DEPRECATION WARNING
This documentation is not using the current rendering mechanism and is probably outdated. The extension maintainer should switch to the new system. Details on how to use the rendering mechanism can be found here.
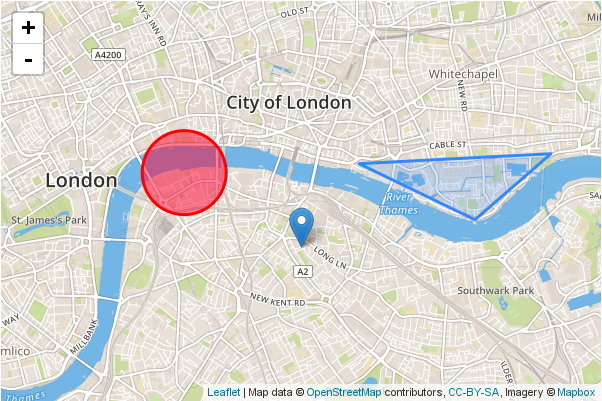
Leaflet map with a marker, a circle (red) and a polygon (blue). Live @ http://leafletjs.com/examples/quick-start/
Polygon
Code-Snippet
L.polygon([
  [51.509, -0.08],
  [51.503, -0.06],
  [51.51, -0.047]
], {
  color: 'red',
  fillColor: 'white',
  fillOpacity: 0.4,
  smoothFactor: 4,
}).addTo(map).bindPopup("My polygon with three points :)");
Leaflet documentation @ http://leafletjs.com/reference.html
Container
- Please create a folder in your TYPO3 backend. Call it: "Additional Content for Leaflet"
- Create an HTML content element within this folder.
- Call it: "My Polygon in London"
- Set [Appearance] > "Indentation and Frames" to [browser: No frame (i.e. for javascript)]
- Copy the code from above and paste it into the HTML content field.
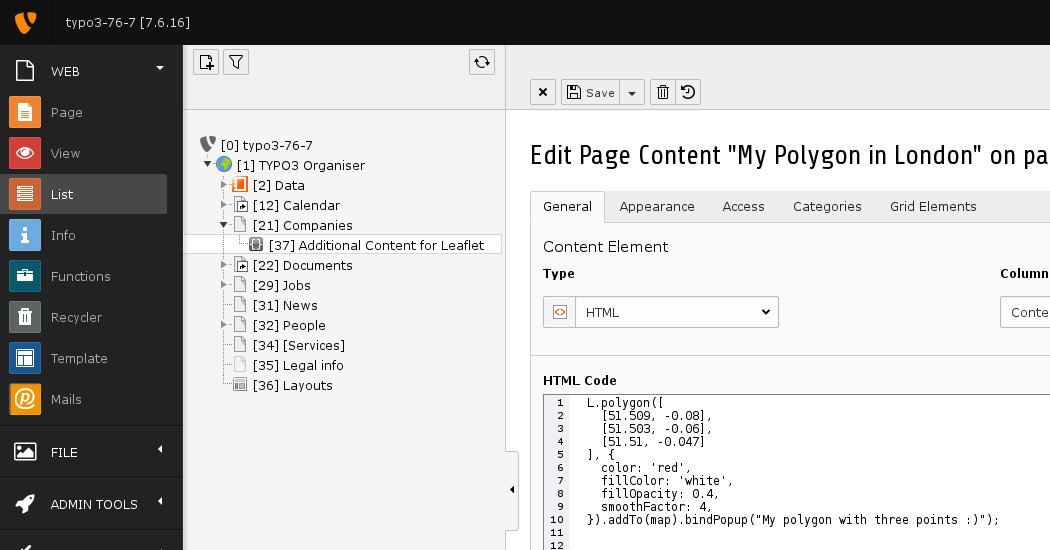
The HTML content element with the code from above
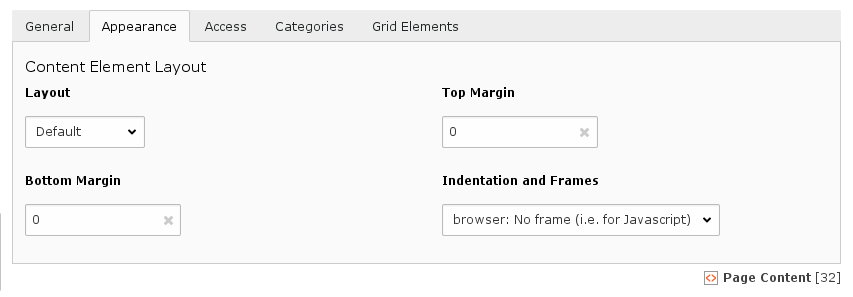
The HTML content element without any frame. You will get a Javascript error in the frontend, if you are using a frame!
Setup
Constant Editor > Category [BROWSERMAPS - ADDITIONAL CONTENT]
- Set the "Pid" to the Pid of the folder "Additional Content for Leaflet" from above.
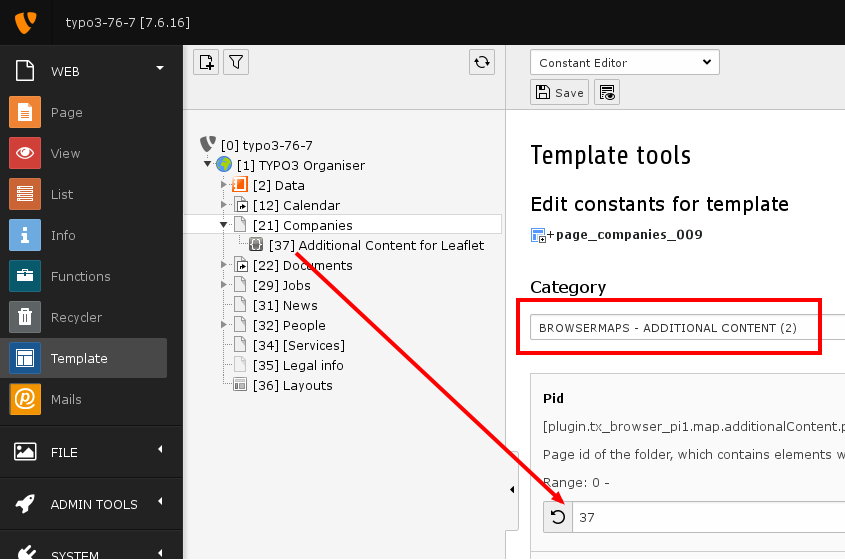
BrowserMaps need to know the pid of the folder only
Result
Check the result in the frontent.
Look for London and zoom in.
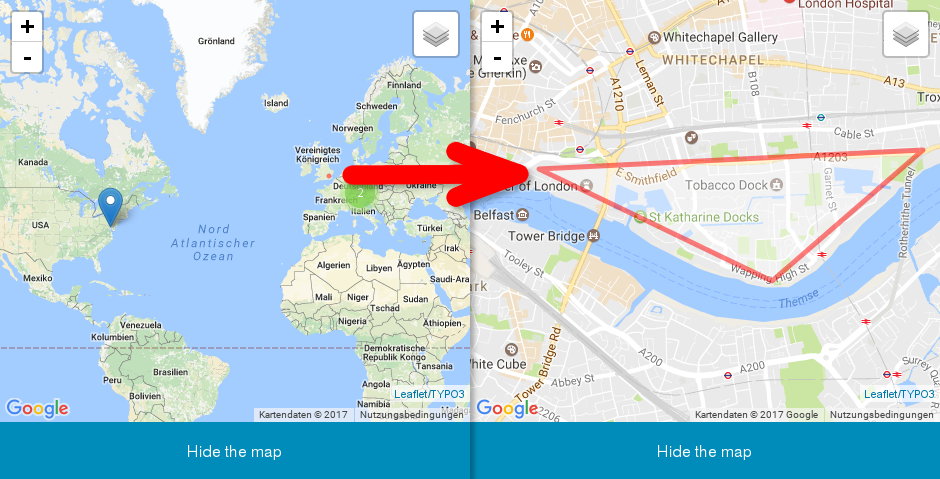
The polygon in London. Left hand: a small dot. Right hand: the polygon