DEPRECATION WARNING
This documentation is not using the current rendering mechanism and is probably outdated. The extension maintainer should switch to the new system. Details on how to use the rendering mechanism can be found here.
EXT: My Extension
| Author: | Kasper Skårhøj |
|---|---|
| Created: | 2002-11-01T00:32:00 |
| Changed by: | Slawa |
| Changed: | 2008-05-31T01:19:48 |
| Author: | Slawa |
| Email: | slapidya(at)yahoo.com |
| Info 3: | |
| Info 4: |
EXT: My Extension
Extension Key: phploadavg
Copyright 2000-2002, Slawa, <slapidya(at)yahoo.com>
This document is published under the Open Content License
available from http://www.opencontent.org/opl.shtml
The content of this document is related to TYPO3
- a GNU/GPL CMS/Framework available from www.typo3.com
Table of Contents
EXT: My Extension 1
Introduction 1
What does it do? 1
Screenshots 1
Users manual 1
FAQ 1
Adminstration 1
FAQ 2
Configuration 2
FAQ 2
Reference 2
Tutorial 2
Known problems 2
To-Do list 2
Changelog 2
Introduction
What does it do?
phploadavg displays a chart of the average load of a Linux system. It can render the chart in PNG file (requires GDlib) or as an HTML table. Can be configured to show some system information as well (disabled by default). Requires zero installation effort. Just put the extension on any page and see it working. It needs to be kept running in the browser to collect data for the chart.
NEW: It integrates itself with mydashboard plugin.
NEW: BE module is working too.
Extension is based on a PHP script with the same name: http://phploadavg.sourceforge.net/
Live example can be seen at http://www.rechnung- plus.de/cms/index.php?id=60
Screenshots
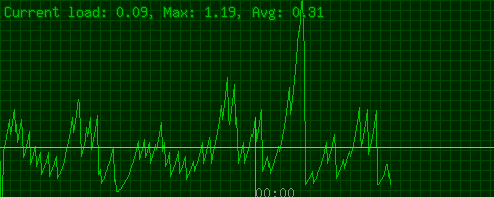 Illustration 1: PNG version of the chart
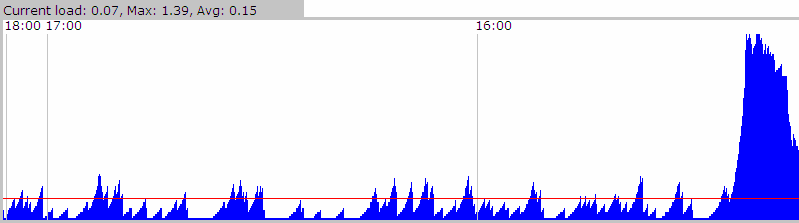 Illustration 2: HTML table version of the chart
Users manual
- Install the extension from the repository. Extension key: “phploadavg” ( link ).
- Put the extension in any page as a content element. View it in FE. Done.
- Optionally you can install the mydashboard ( http://typo3.org/extensions/repository/view/mydashboard/0.1.7/ ) extension. Phploadavg will be shown as one of the dashboard plugins.
FAQ
How to configure the extension?
Configuration is not built in the TYPO3, so at the moment, you would need to modify the PHP file of the extension to change colors, image size, switch to HTML generated chart or enable the system information display. Modifying should not be a problem as the extension is make with good OOD/OOP.
Where can I configure the additional information to be shown?
As there is no configuration options, you would need to modify phploadavg/index.php file directly. In the end of the method phploadavg::main() you will find a code dealing with pla_sysinfo class. Uncomment it or set $this->showSysInfo to TRUE (depends on the version of the plugin you have). The displaying of this information is only working in HTML mode of the chart.
Where is the switch to display a image file or a table?
To enable HTML output of the chart modify the lineclass phploadavg_mysql extends phploadavg_gif {toclass phploadavg_mysql extends phploadavg_table {
If I add phploadavg plug-in into my content, some of my CSS buttons turn smaller and I cant scroll down my content anymore. The source of page shows me that the rest of the content is still there, but there are no scroll bars.
There are some CSS files which phploadavg plug-in is adding to the output. You can see/modify them in file class.pla_factory_typo3.php method outputHTMLHead().
I found a bug, I want to request a feature, I have an idea!
Please contact slapidya(at)yahoo.com
To-Do list
- Finish BE module showing the same chart for BE users.
- Refresh just the GIF – don't refresh the whole page.
- Having easy configuration options.
- Working on Windows servers and Linux servers which don't have /proc/ directory.
- Easy configurable skins for charts.
- Charts as Flash – nicer graphics, no refresh for update required.
- HTML chart can be generated on the client side without refreshing the whole page (AJAX).
- What is your idea? (slapidya(at)yahoo.com)
Changelog
- Original script of phploadavg was working with PostgreSQL databases only and was using HTML tables to show chart.
- REFACTOR to have OOD/OOP code.
- ADD storing charts in session (no database required).
- ADD storing charts in MySQL (TYPO3 support is coming)
- ADD TYPO3 plugin is made
- ADD generating graphs in PNG files – now it's default
- ADD support for mydashboard ( http://typo3.org/extensions/repository/view/mydashboard/0.1.7/ ) extension. Phploadavg is shown as one of the dashboard plugins.
 EXT: My Extension - 3