DEPRECATION WARNING
This documentation is not using the current rendering mechanism and is probably outdated. The extension maintainer should switch to the new system. Details on how to use the rendering mechanism can be found here.
Gantt graphs display (Display)
The “Display” form has only one view: “Display_List”. This view displays only one field named “graph”. Its configuration is the following:
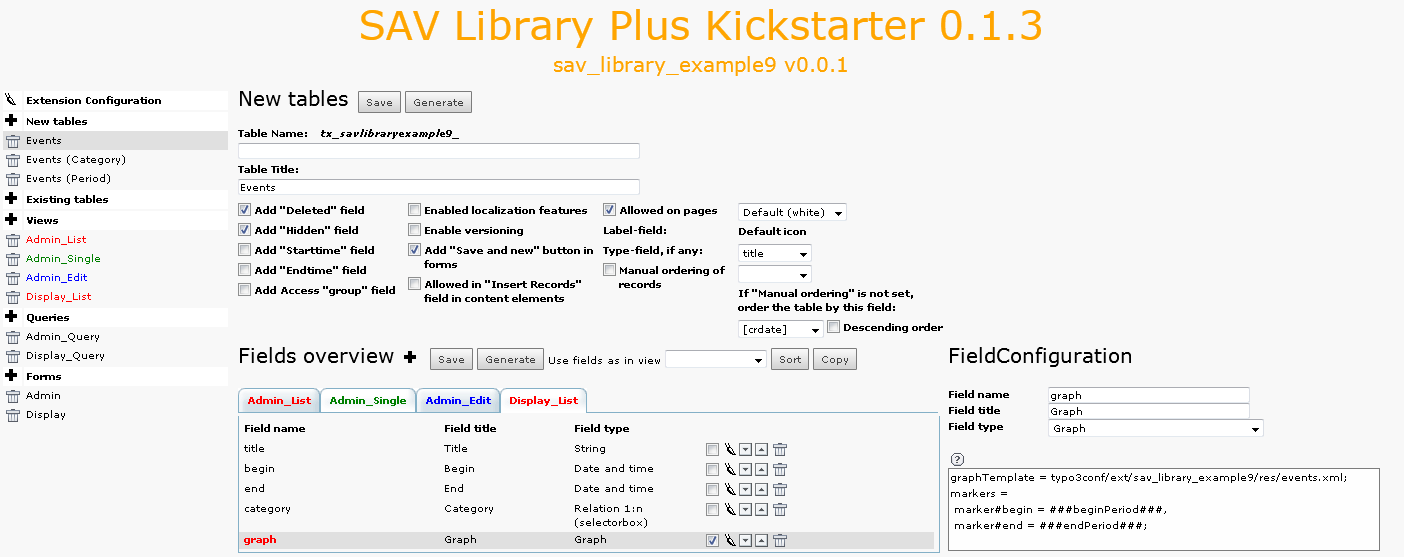
The fields with a type Graph are not created in the database. They are displayed in the view if selected.
The configuration includes several lines:
graphTemplate = typo3/ext/sav\_library\_example9/Resources/Private/Files/events.xml;
It defines the file to be used as a template for the graph display.
markers = marker#begin = ###beginPeriod###, marker#end = ###endPeriod###;
This attribute is used to define XML SAV JpGraph markers. The syntax is a comma-separated list of definitions. Let us analyze the first one: “marker#begin = ###beginPeriod###”. It says that the “marker” whose id is “begin” in the template will be replace by the SAV Library marker “###beginPeriod###”, that is by the alias “beginPeriod”. Thus it is necessary for this alias to be defined as shown in the query section of the form.
Now, download the extension “sav_jpgraph” from the TER and install it.
Then, install the extension in the page where you want to display the graph.
- In page properties, set the General Record Storage Page to the sysfolder containing your events.
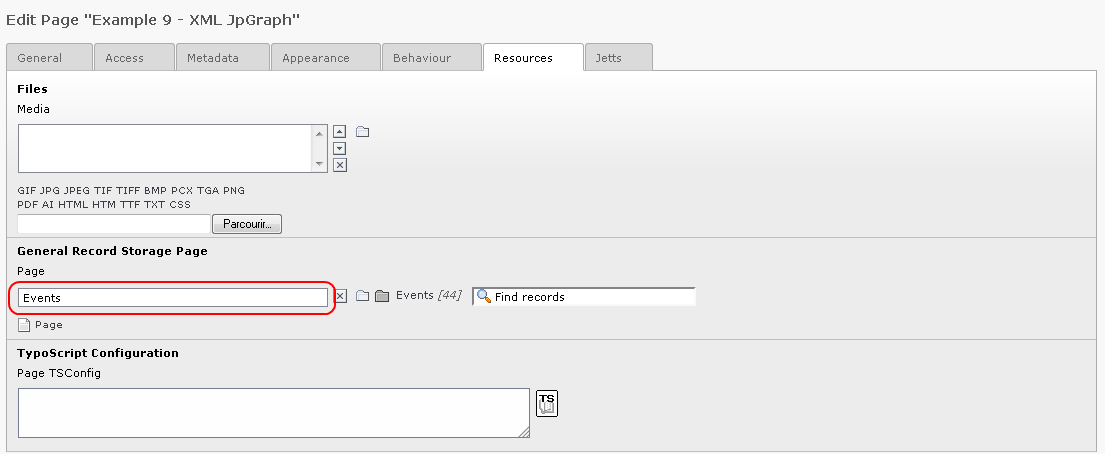
- In the folder tab “Input controls”, uncheck “Input on form”.
- Save and go to your Front End page. You should obtain something similar to the following view, depending on your events.
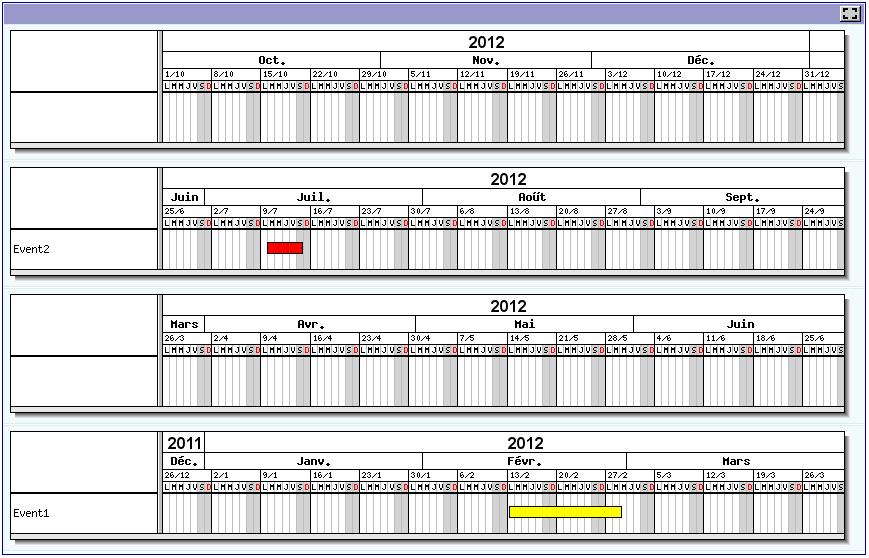
- Finally, open the files “events.xml” and “eventsTemplate.xml” in the directory “Resources/Private/Files” of the extension and analyze them. The file “eventsTemplate.xml” is the general template for the graph display (see the extension “sav_jpgraph” for more details). The file “events.xml” contains the user definitions for the references used in the general template. The only tricky part is the use of the SQL variable @row to number the position of the bar plots.