Debugging
PHP
Xdebug
First of all: best practice to debug PHP code is using an IDE (like PhpStorm or Visual Studio Code) with Xdebug. Advantages are:
- You can investigate the values of variables and class properties when setting a breakpoint.
- You can move forward line by line and see how the variables and properties change.
- You can also step into calling methods and functions.
- You see the calling code as a stack trace.
DebugUtility::debug()
The TYPO3 Core provides a simple debug() (defined in
EXT:core/Classes/Core/GlobalDebugFunctions.php). It wraps around
\TYPO3\CMS\Core\Utility\DebugUtility::debug() and will output debug
information only if it matches a set of IP addresses (defined in
$GLOBALS['TYPO3_CONF_VARS']['SYS']['devIPmask']).
For example, the following code:
use TYPO3\CMS\Core\Utility\DebugUtility;

class ModuleController extends ActionController implements LoggerAwareInterface
{
    protected function debugCookies() {
        DebugUtility::debug($_COOKIE, 'cookie');
    }
}will produce such an output:
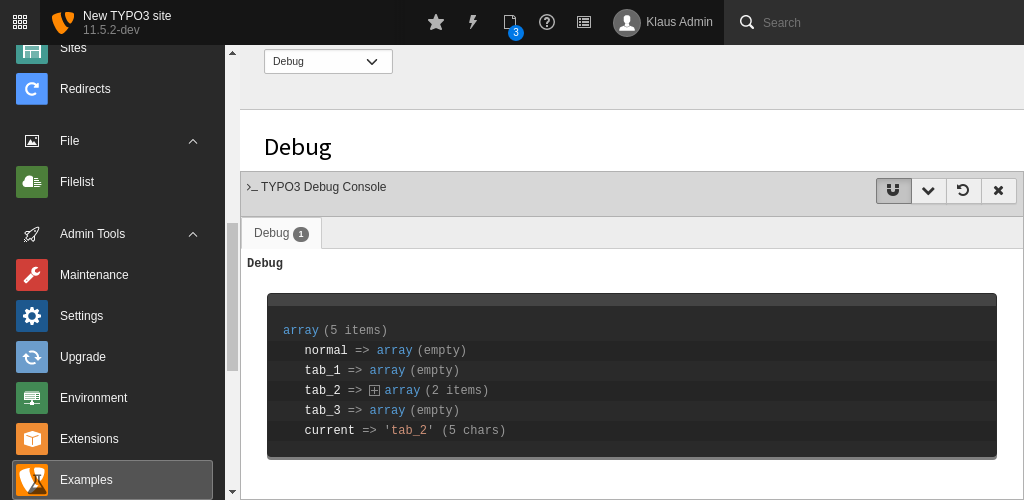
Typical TYPO3 debug output
In general, look at class \TYPO3\CMS\Core\Utility\DebugUtility for useful
debugging tools.
TYPO3 backend debug mode
To display additional debug information in the backend, set
$GLOBALS['TYPO3_CONF_VARS']['BE']['debug']
in config/system/settings.php and log in with an administrator
account.
It shows for example the names of fields and in case of select, radio and checkbox fields the values in addition, which are generated by the FormEngine. These can be used to set access permissions or configuration using TSconfig.
If EXT:lowlevel is installed, the name of the database table or field is appended to the select options in the System > DB Check > Full Search module.
Additionally, in debug mode, the page renderer does not compress or concatenate JavaScript or CSS resources.