Debugging a page
Click Debug on the Admin Panel bar to show general information about the page.

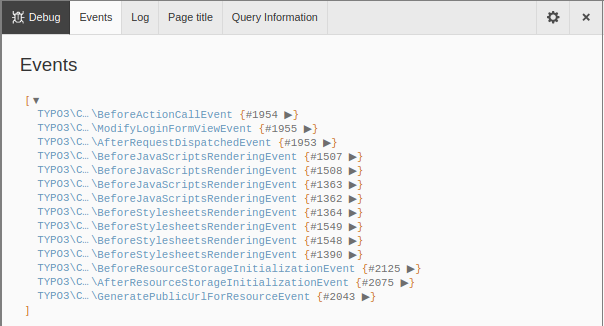
The Events tab of the Debug section of the Admin Panel
There are four tabs in the Debug section.
Events
The Events list shows all events that were dispatched while the current page was rendered. A developer can use this list while extending TYPO3 to find out which event to use on any given page.
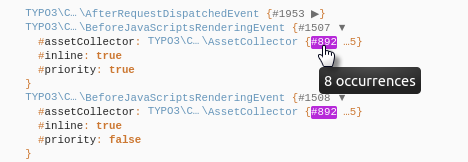
Click the arrow to expand the details for an event to see basic information about the event's parameters.

An expanded event showing extra detail
Log
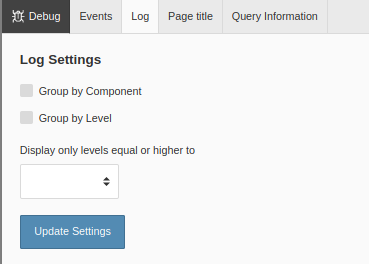
The log tab shows all log entries that were generated during the current request. You can adjust the log levels and grouping in the settings.
Click the cog icon at the top right of the Admin Panel bar to configure the settings.

The settings for the Log entries
Page title
TYPO3 has a concept of “Page Title Providers”. The section “Page title” displays all registered providers that were checked for the current page. This helps to debug where the currently used page title is coming from.
Query Information
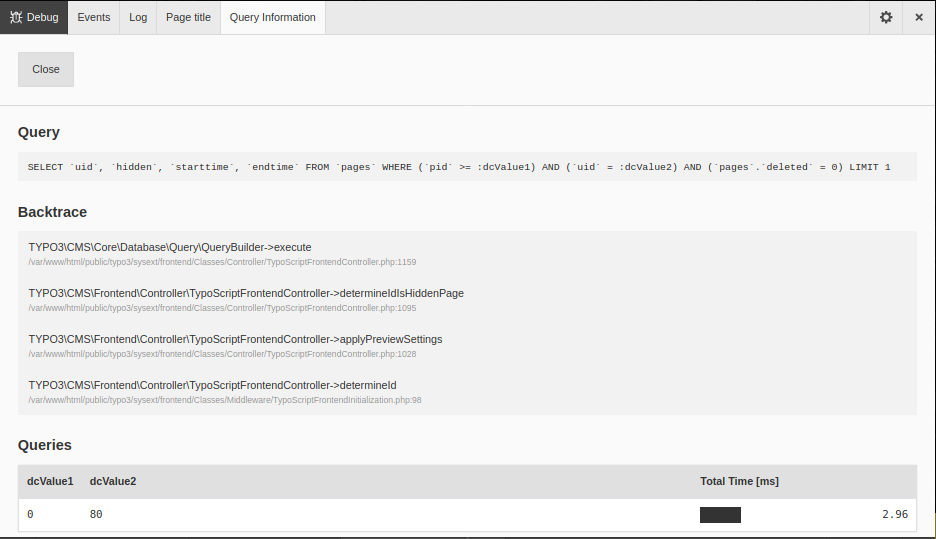
Displays a list of SQL queries that were generated on the current page and their performance.

The Query tab of the Debug section of the Admin Panel
Click on a query to open a detail view with the values used for the placeholders.

The values used in a query run on the page
Note
The list of SQL queries misses around 20 boot queries as they are executed before logging is enabled.
