Debugging / analyzing
Debugging TypoScript can be complicated as there are many influences like the active page and conditions. Also constants can be used which get substituted. The following sections provide information about how to debug TypoScript and how to find errors within TypoScript.
Analyzing defined constants
The backend submodule Sites > TypoScript > Active TypoScript provides a tree view to all defined TypoScript Constants on the currently active page.
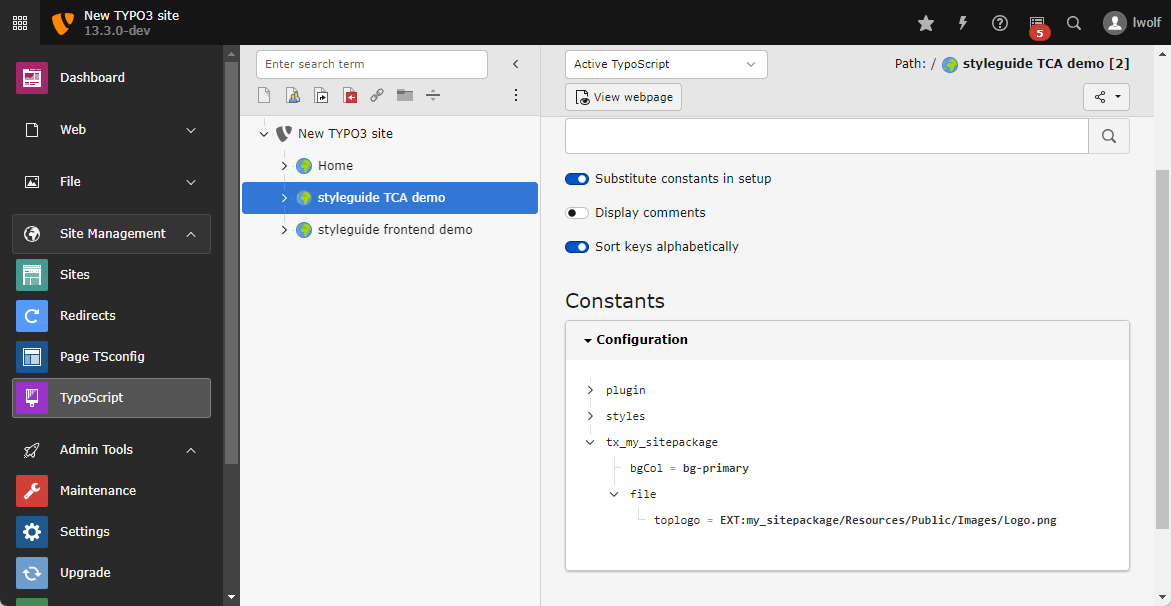
Analyzing defined TypoScript Constants in the Active TypoScript submodule.
Finding errors
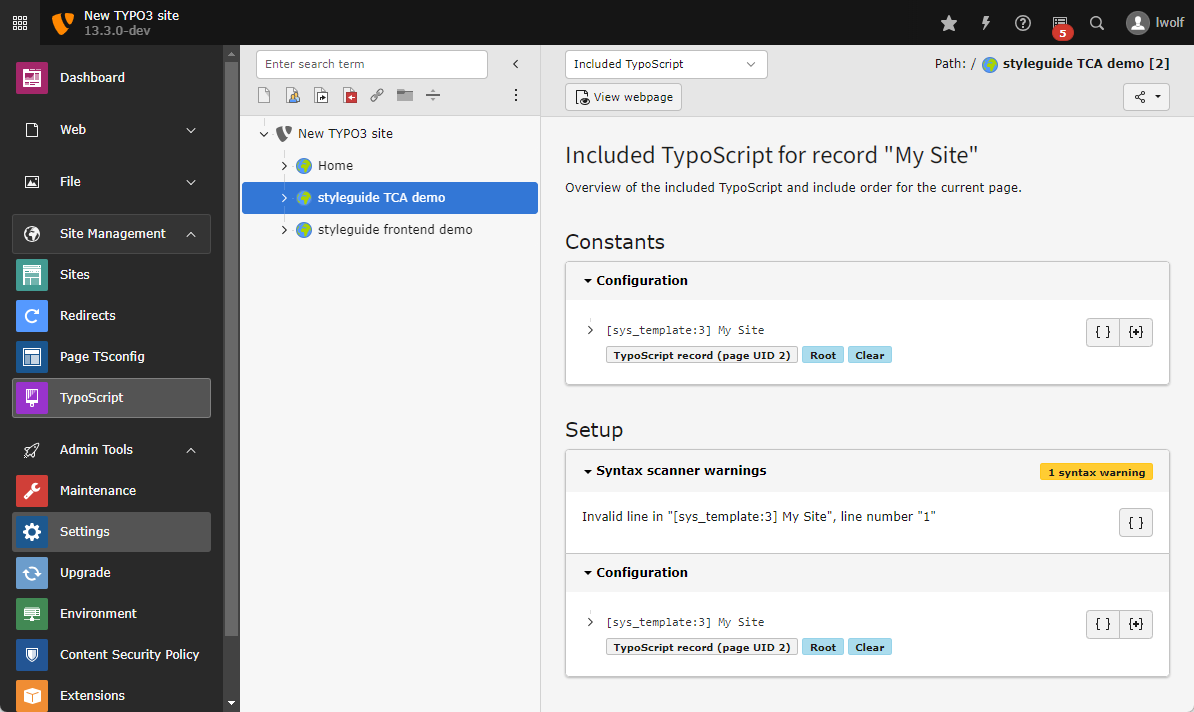
There are no tools that will tell whether the given TypoScript code is 100% correct. The Included TypoScript will warn about syntax errors though:
In the frontend, the typo3/cms-adminpanel is another possibility to debug TypoScript: use its section called TypoScript. It shows selected rendered (configuration) values, SQL queries, error messages and more.
Debugging
TypoScript itself offers a number of debug functions:
- stdWrap comes with the properties , and which help checking which values are currently available and which configuration is being handled.
- TMENU comes with the property
debugItemConf.
If set to
1, it outputs the configuration arrays for each menu item. Useful to debug optionSplit things and such.