Users manual
Frontend Plugin
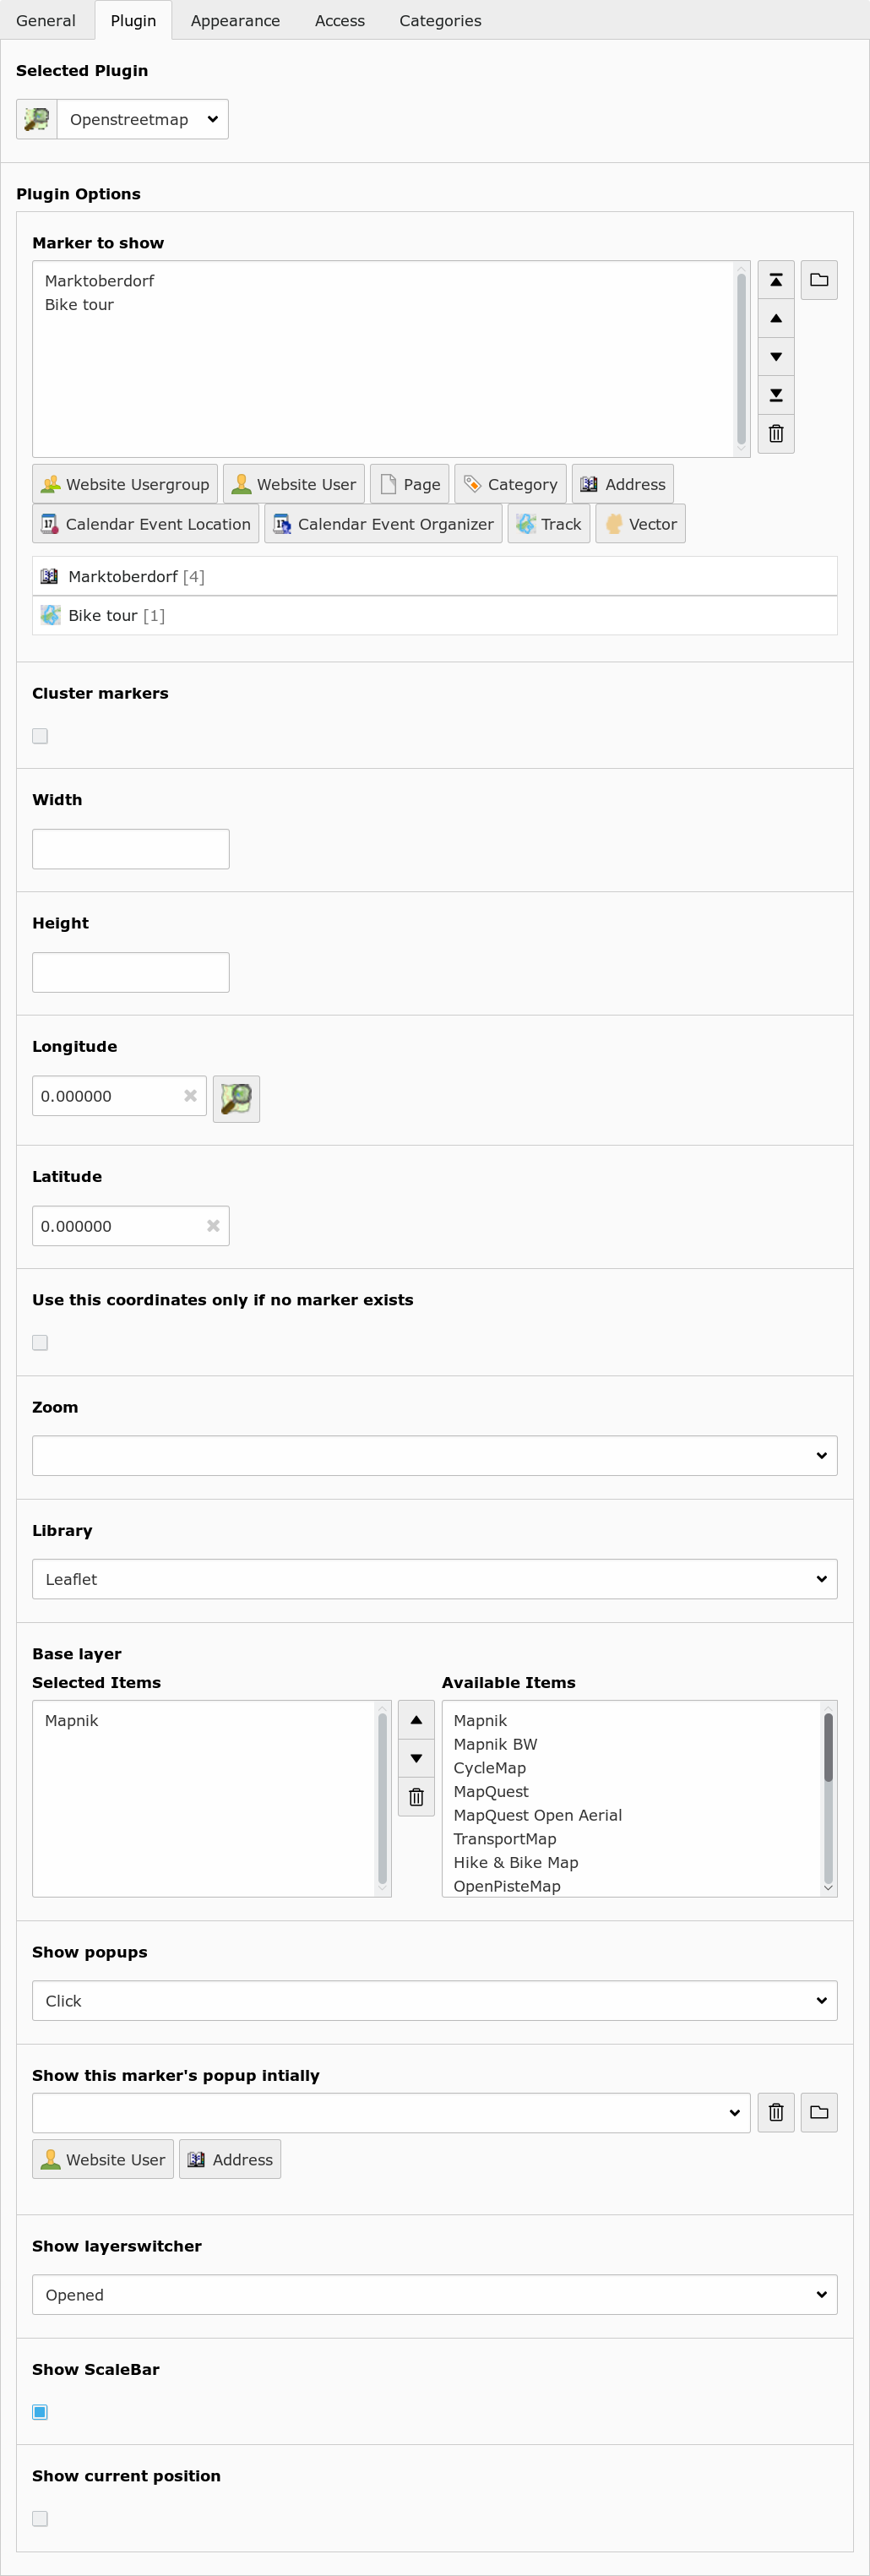
Insert the Openstreetmap as frontend plugin and define at least one marker to show. The map will center to the average coordinates of the markers.
| Plugin option (TS option) | Description |
|---|---|
| Marker to show (marker) | Show these records on the map. |
| Cluster markers (cluster) | Group nearby markers. |
| Width (width) | Width of the map in pixels. |
| Height (height) | Height of the map in pixels. |
| Longitude (lon) | Default longitude. |
| Latitude (lat) | Default latitude. |
| Use this coordinates only if no marker exists (use_coords_only_nomarker) | If unset, the map is always centered at the given coordinates. If set, the map is only centered there if no marker exists. |
| Zoom (zoom) | Zoom level. |
| Library (library) | Choose between openlayers, leaflet or static. |
| Base layer (layer) | Show this map. The user can switch between these base layers if the layerswitcher is is enabled. |
| Show popups (show_popups) | Show a popup window with record information if the user hover or click a marker. |
| Show this marker’s popup initially (marker_popup_initial) | Open this marker’s popup if the user visit the map. |
| Mouse navigation (mouse_navigation) | Allow navigation with the mouse. |
| Show pan/zoom (show_pan_zoom) | Show pan/zoom element. |
| Show layerswitcher (show_layerswitcher) | Show layerswitcher which allows the user to hide markers from the same group. |
| Show scalebar (show_scalebar) | Show pan/zoom element. |
| Show current position (position) | Center the map on the current position of the user (if available) |
New elements
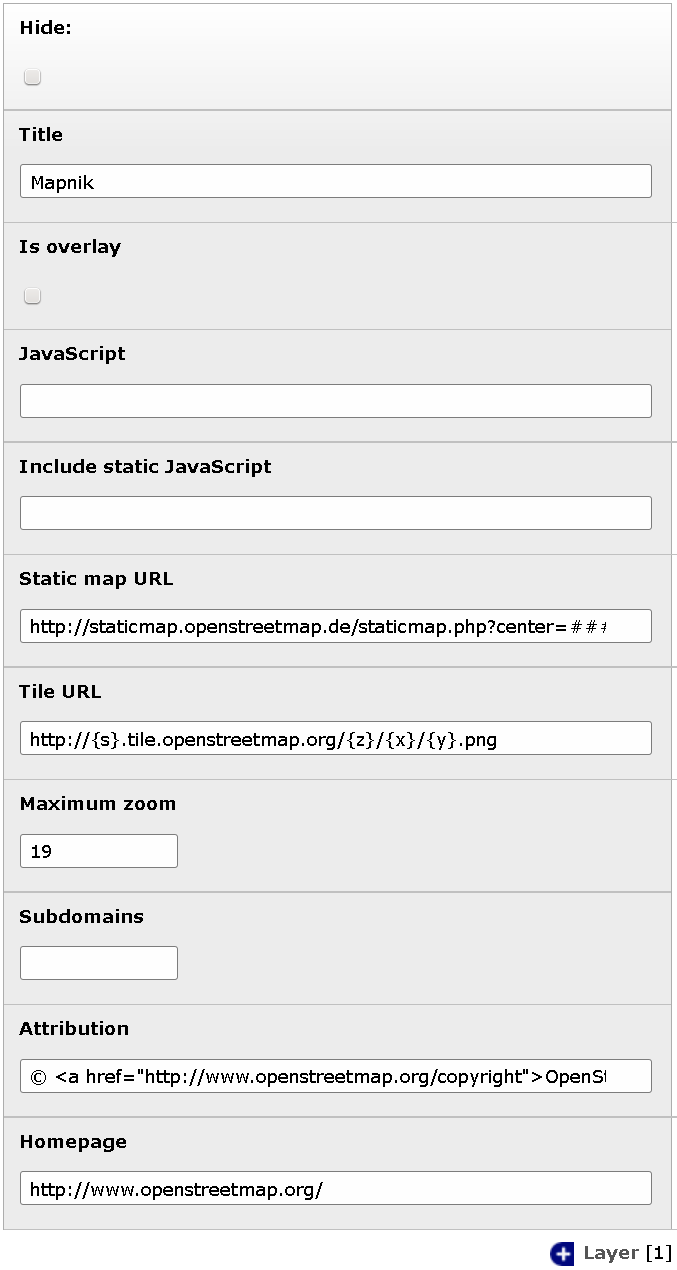
Layer
You can define your own layers on root level.
| Element option | Description |
| Title | Title of this layer. Shown in layerswitcher. |
| Is overlay | Base layer or overlay layer? |
| JavaScript | JavaScript part to create this layer.
###TITLE###: Title of layer.
###VISIBLE###: Contains “’visible’:true” if
is overlay and no layerswitcher activated.
|
| Include static JavaScript | Optionally include this javascript file.
###STATIC_SCRIPT###: Value set by TS
|
| Static map URL | Download static map from this URL.
###lat###: Latitude of map center.
###lon###: Longitude of map center.
###zoom###: Zoom level.
###width###: Image width.
###height###: Image height.
|
| Tile URL | URL to fetch tiles. Used by OpenLayers if no JavaScript defined. Used by leaflet. |
| Maximum zoom | Maximum zoom level of this layer. |
| Subdomains | Tile URL subdomains (Variable {s}) |
| Attribution | Attribution text of this layer. |
| Homepage | Homepage URL of this layer. |
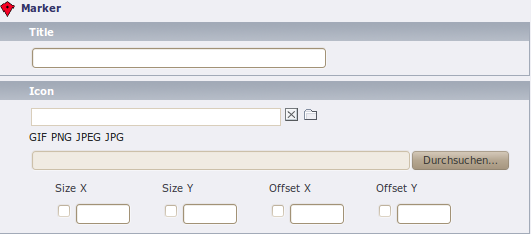
Marker
| Element option | Description |
| Title | Title for this track. Only shown in backend. |
| Icon | Icon file. |
| Size | The size of the icon. Would determined automatically on save. |
| Offset | The offset of the icon. It describes the arrowhead. Would automatically choose the middle bottom of the image. |
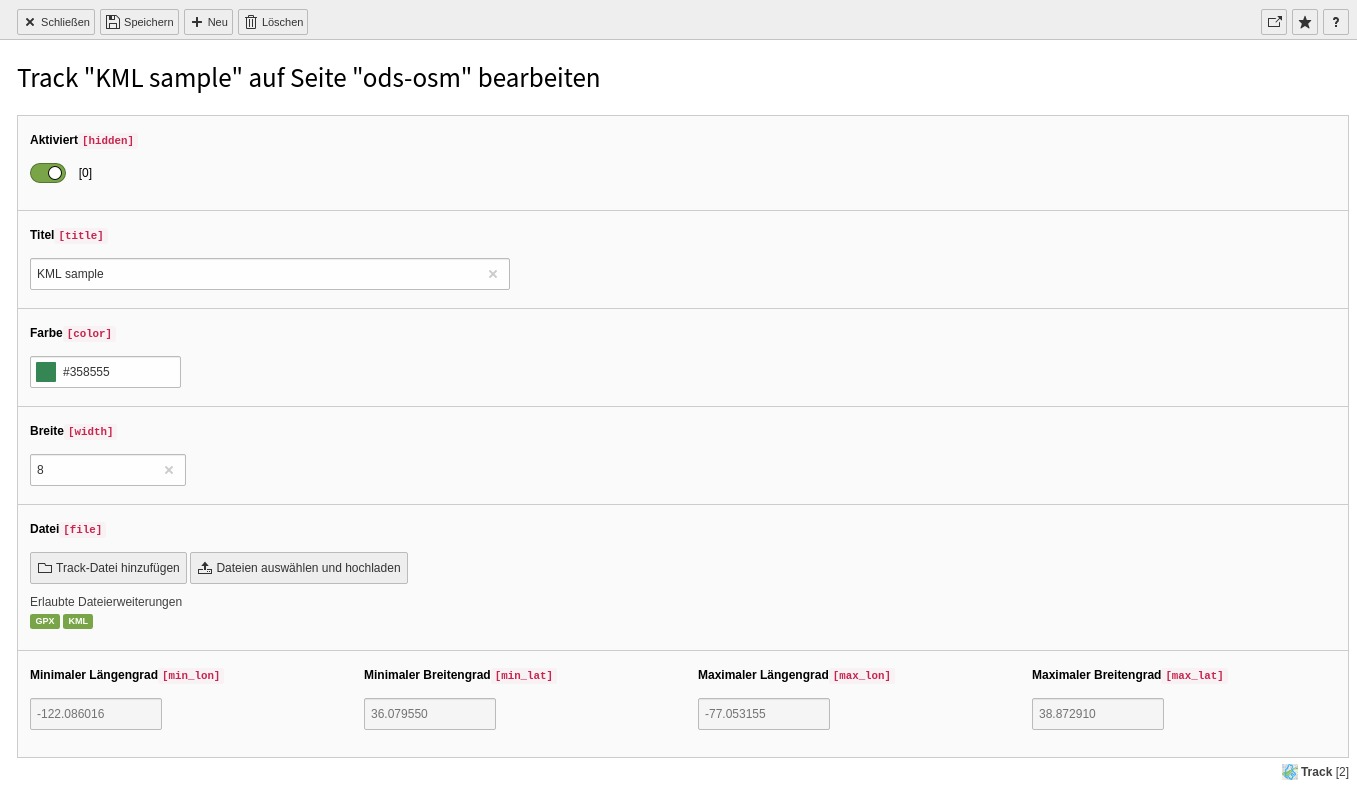
Track
| Element option | Description |
| Title | Title for this track. Shown in layerswitcher. |
| Color | Color of the track line in the map. |
| Width | Width of the track line. |
| File | Select only one gpx file here. |
Vector
You can add GeoJSON data and/or a GeoJSON file to display on a new layer. The GeoJSON may contain FeatureCollections. Polygone, Lines and Points are tested and are supported by the vector draw wizard.
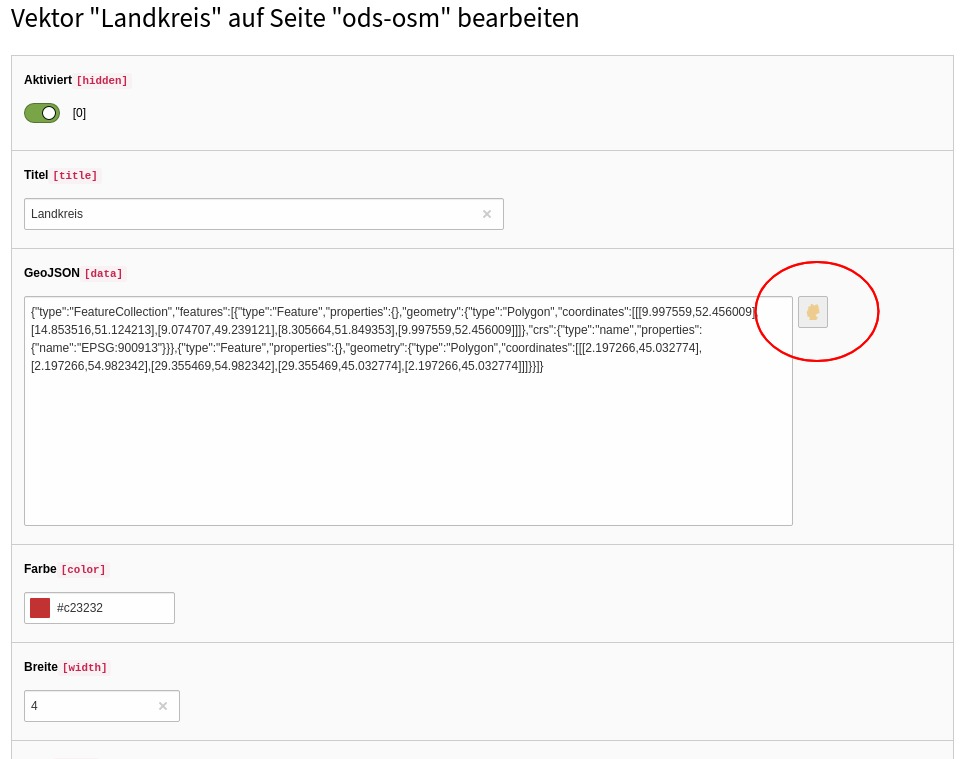
| Element option | Description |
| Title | Title for this vector. Shown in layerswitcher. |
| GeoJSON | Fill GeoJSON data and/or select a GeoJSON file below. You can use the vector draw wizard to create and edit the GeoJSON data in this field. |
| Color | Color of the vector line in the map (optional). |
| Width | Width of the vector polyline. (optional) |
| File | Select only one geojson file here. |
Extended elements
Website user
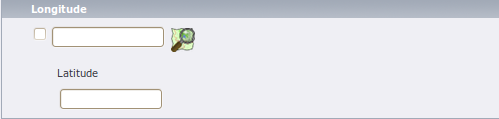
| Element option | Description |
| Longitude and Latitude | Enter the coordinates of an address here. It would determined automatically if zip or city is set and autocompletion is enabled in the extension manager. Use the OpenStreetMap icon to search the coordinates on the map. |