
Backend module
The extension adds a backend module under System > Firewall. It is available to administrators only.
The module has four views. Switch between them with the View dropdown in the module's doc-header:
- Patterns manages the static block patterns.
- Blocked keys lists the clients that rules have banned automatically.
- Event log lists the recorded firewall events with their details.
- Statistics shows how much traffic the firewall blocked over time.
Patterns
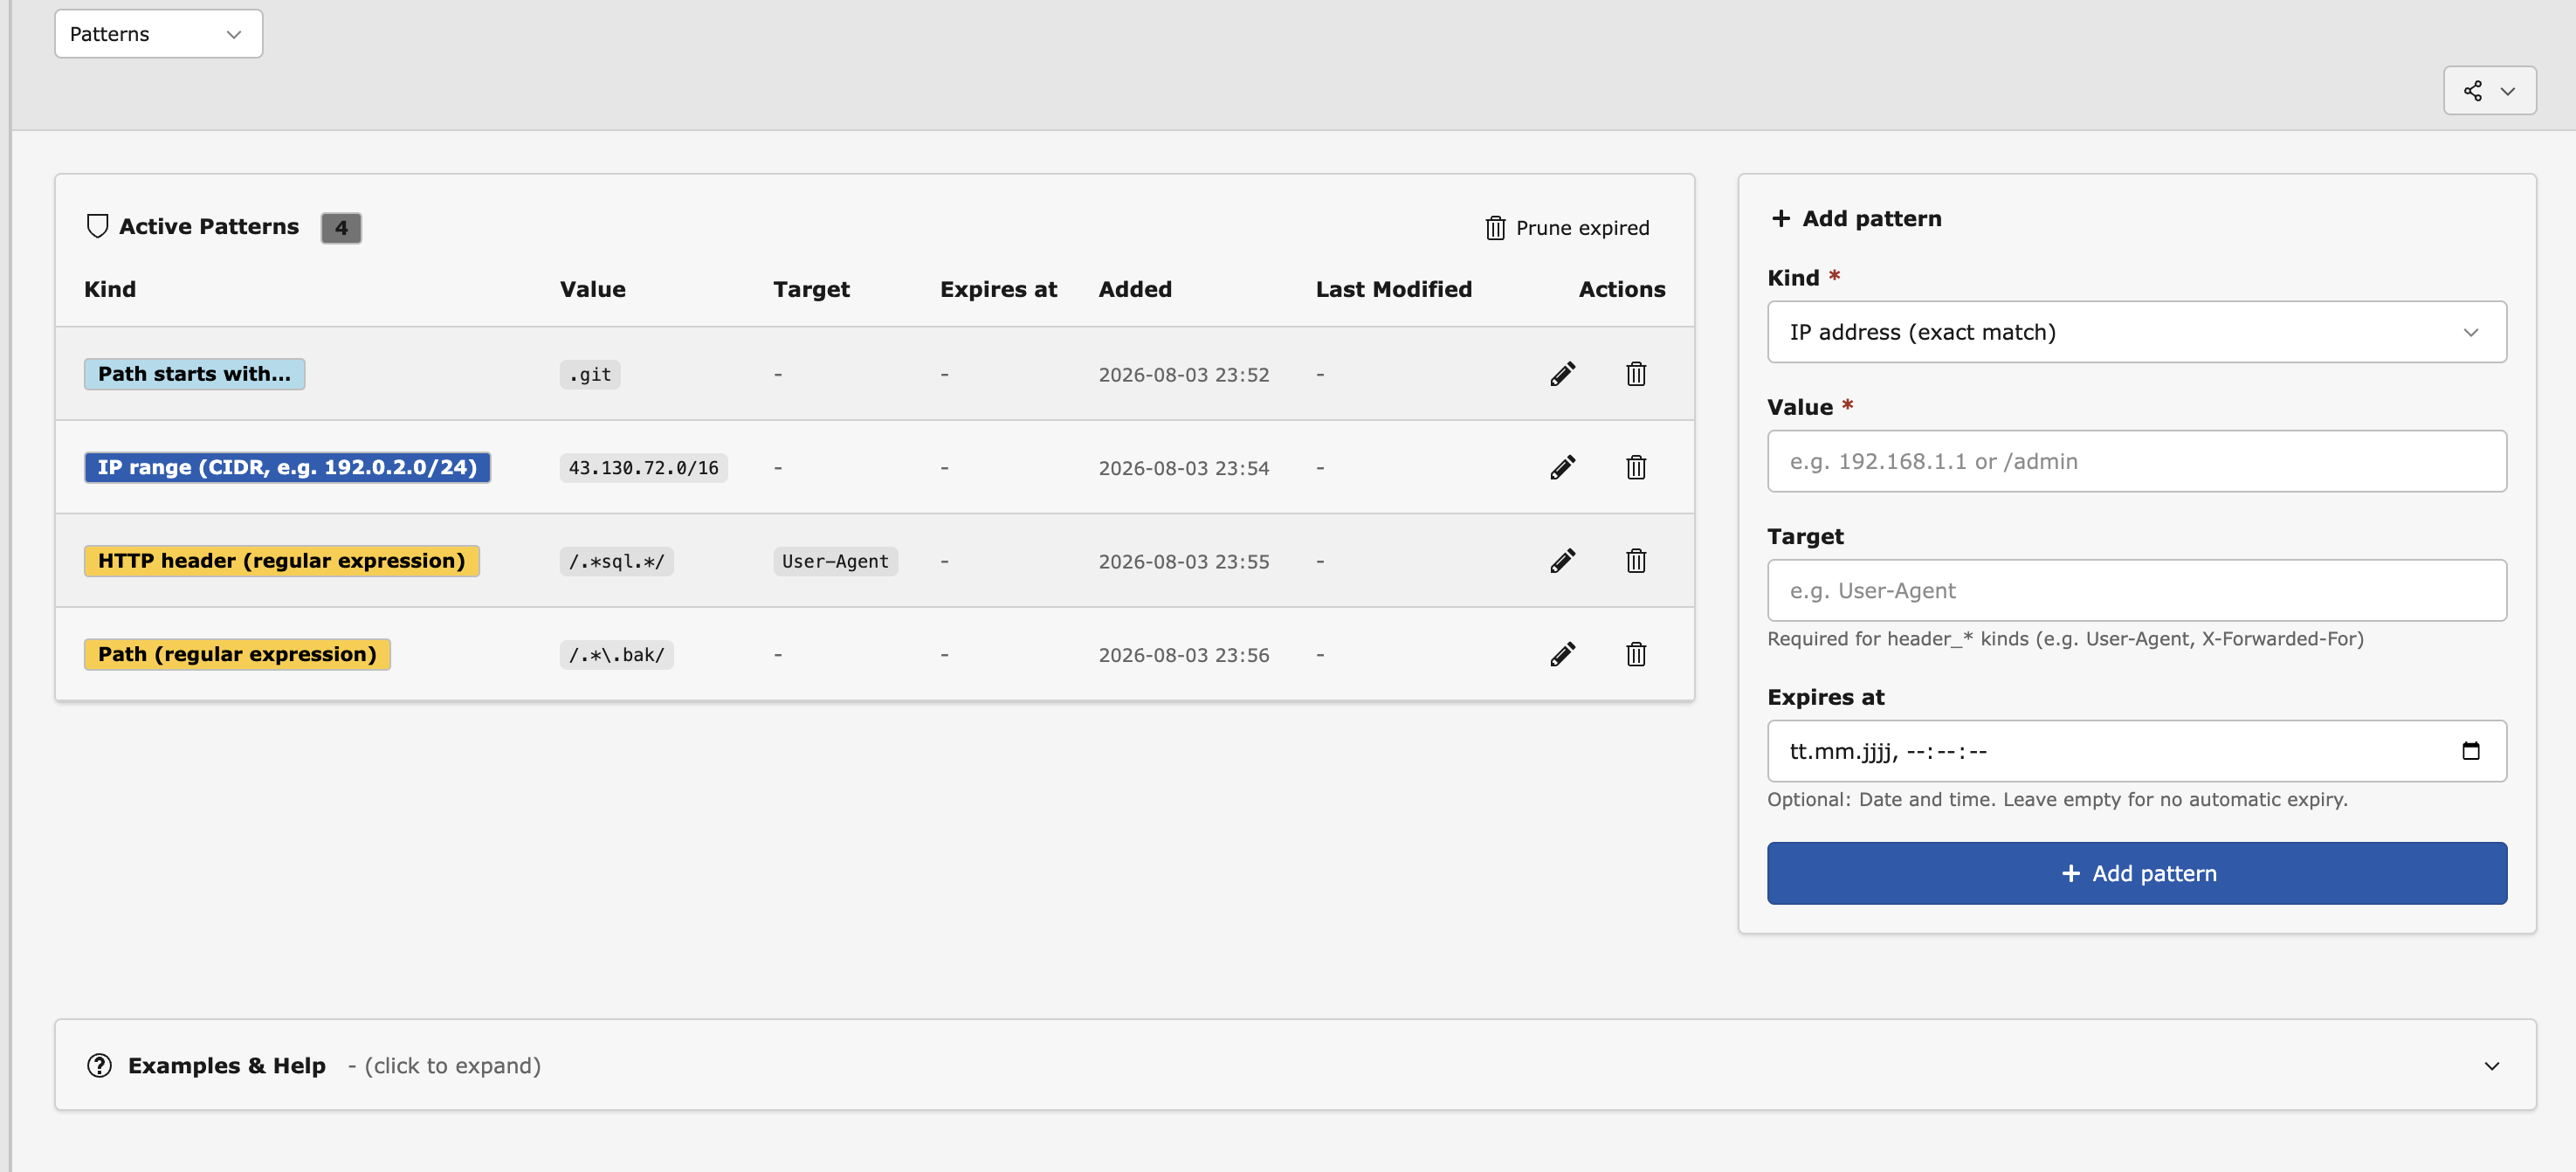
The Patterns view: the active pattern list next to the add and edit form.
This view manages the static block patterns. The extension always adds them
to the firewall as the blocklist rule typo3-blocklist, so they take
effect even when no configuration file exists (see Configuration).
Patterns are stored in the file config/system/phirewall.patterns.json
(classic installation: typo3conf/system/phirewall.patterns.json). The
extension configuration setting patternsDirectory moves the file and its
lock file to another directory, for example when config/system is
read-only at runtime; the directory must lie within the TYPO3 project
directory or BE/lockRootPath (see Configuration).
Every change takes effect on the next request. No deployment and no cache flush are needed.
The pattern list
The Active Patterns list shows one row per pattern with its kind, value, target, expiry date, creation date, and last change. A pattern that has passed its expiry date is highlighted and no longer blocks requests, until you remove it or run a prune (see below).
Add and edit patterns
The form next to the list creates a new pattern. Pick a kind, enter the value, and save. To change a pattern, open it from the list, edit the fields, and save. The form checks the value before it stores the pattern and shows a clear message when something is wrong, for example an invalid IP address or a broken regular expression.
Pattern kinds
A pattern's kind decides what part of the request it compares against.
ip- Blocks one exact client IP address, for example
203.0.113.10. cidr- Blocks a whole IP range in CIDR notation, for example
203.0.113.0/24. path_exact- Blocks requests whose path is exactly this value, for example
/old-login. path_prefix- Blocks requests whose path starts with this value, for example
/.git/. path_regex- Blocks requests whose path matches this regular expression, for example
#^/(\.git|\.env)#. header_exact- Blocks requests where a header has exactly this value. Put the header
name in the target field, for example target
User-Agentand valueBadBot/1.0. header_regex- Blocks requests where a header matches this regular expression. Put the
header name in the target field, for example target
User-Agentand value#(sqlmap|nikto)#i. request_regex- Blocks requests where the regular expression matches a combined string
of the path, the query string, and the request headers, for example
#(union\s+select|<script)#i.
The target field is only used by the two header kinds. For every other kind you can leave it empty.
Expiry and prune
The expiry date is optional. When set, it must lie in the future. An expired pattern stops blocking at once, but its row stays in the list so you can see it. The Prune button deletes all expired patterns in one step.
Integrity check
The view checks the pattern file on every visit. When the file is broken, for example because it holds invalid data or a pattern with an unknown kind, a warning banner appears. The firewall silently skips the affected entries during request handling, so the banner is your signal to open the patterns file and fix or remove them.
Blocked keys
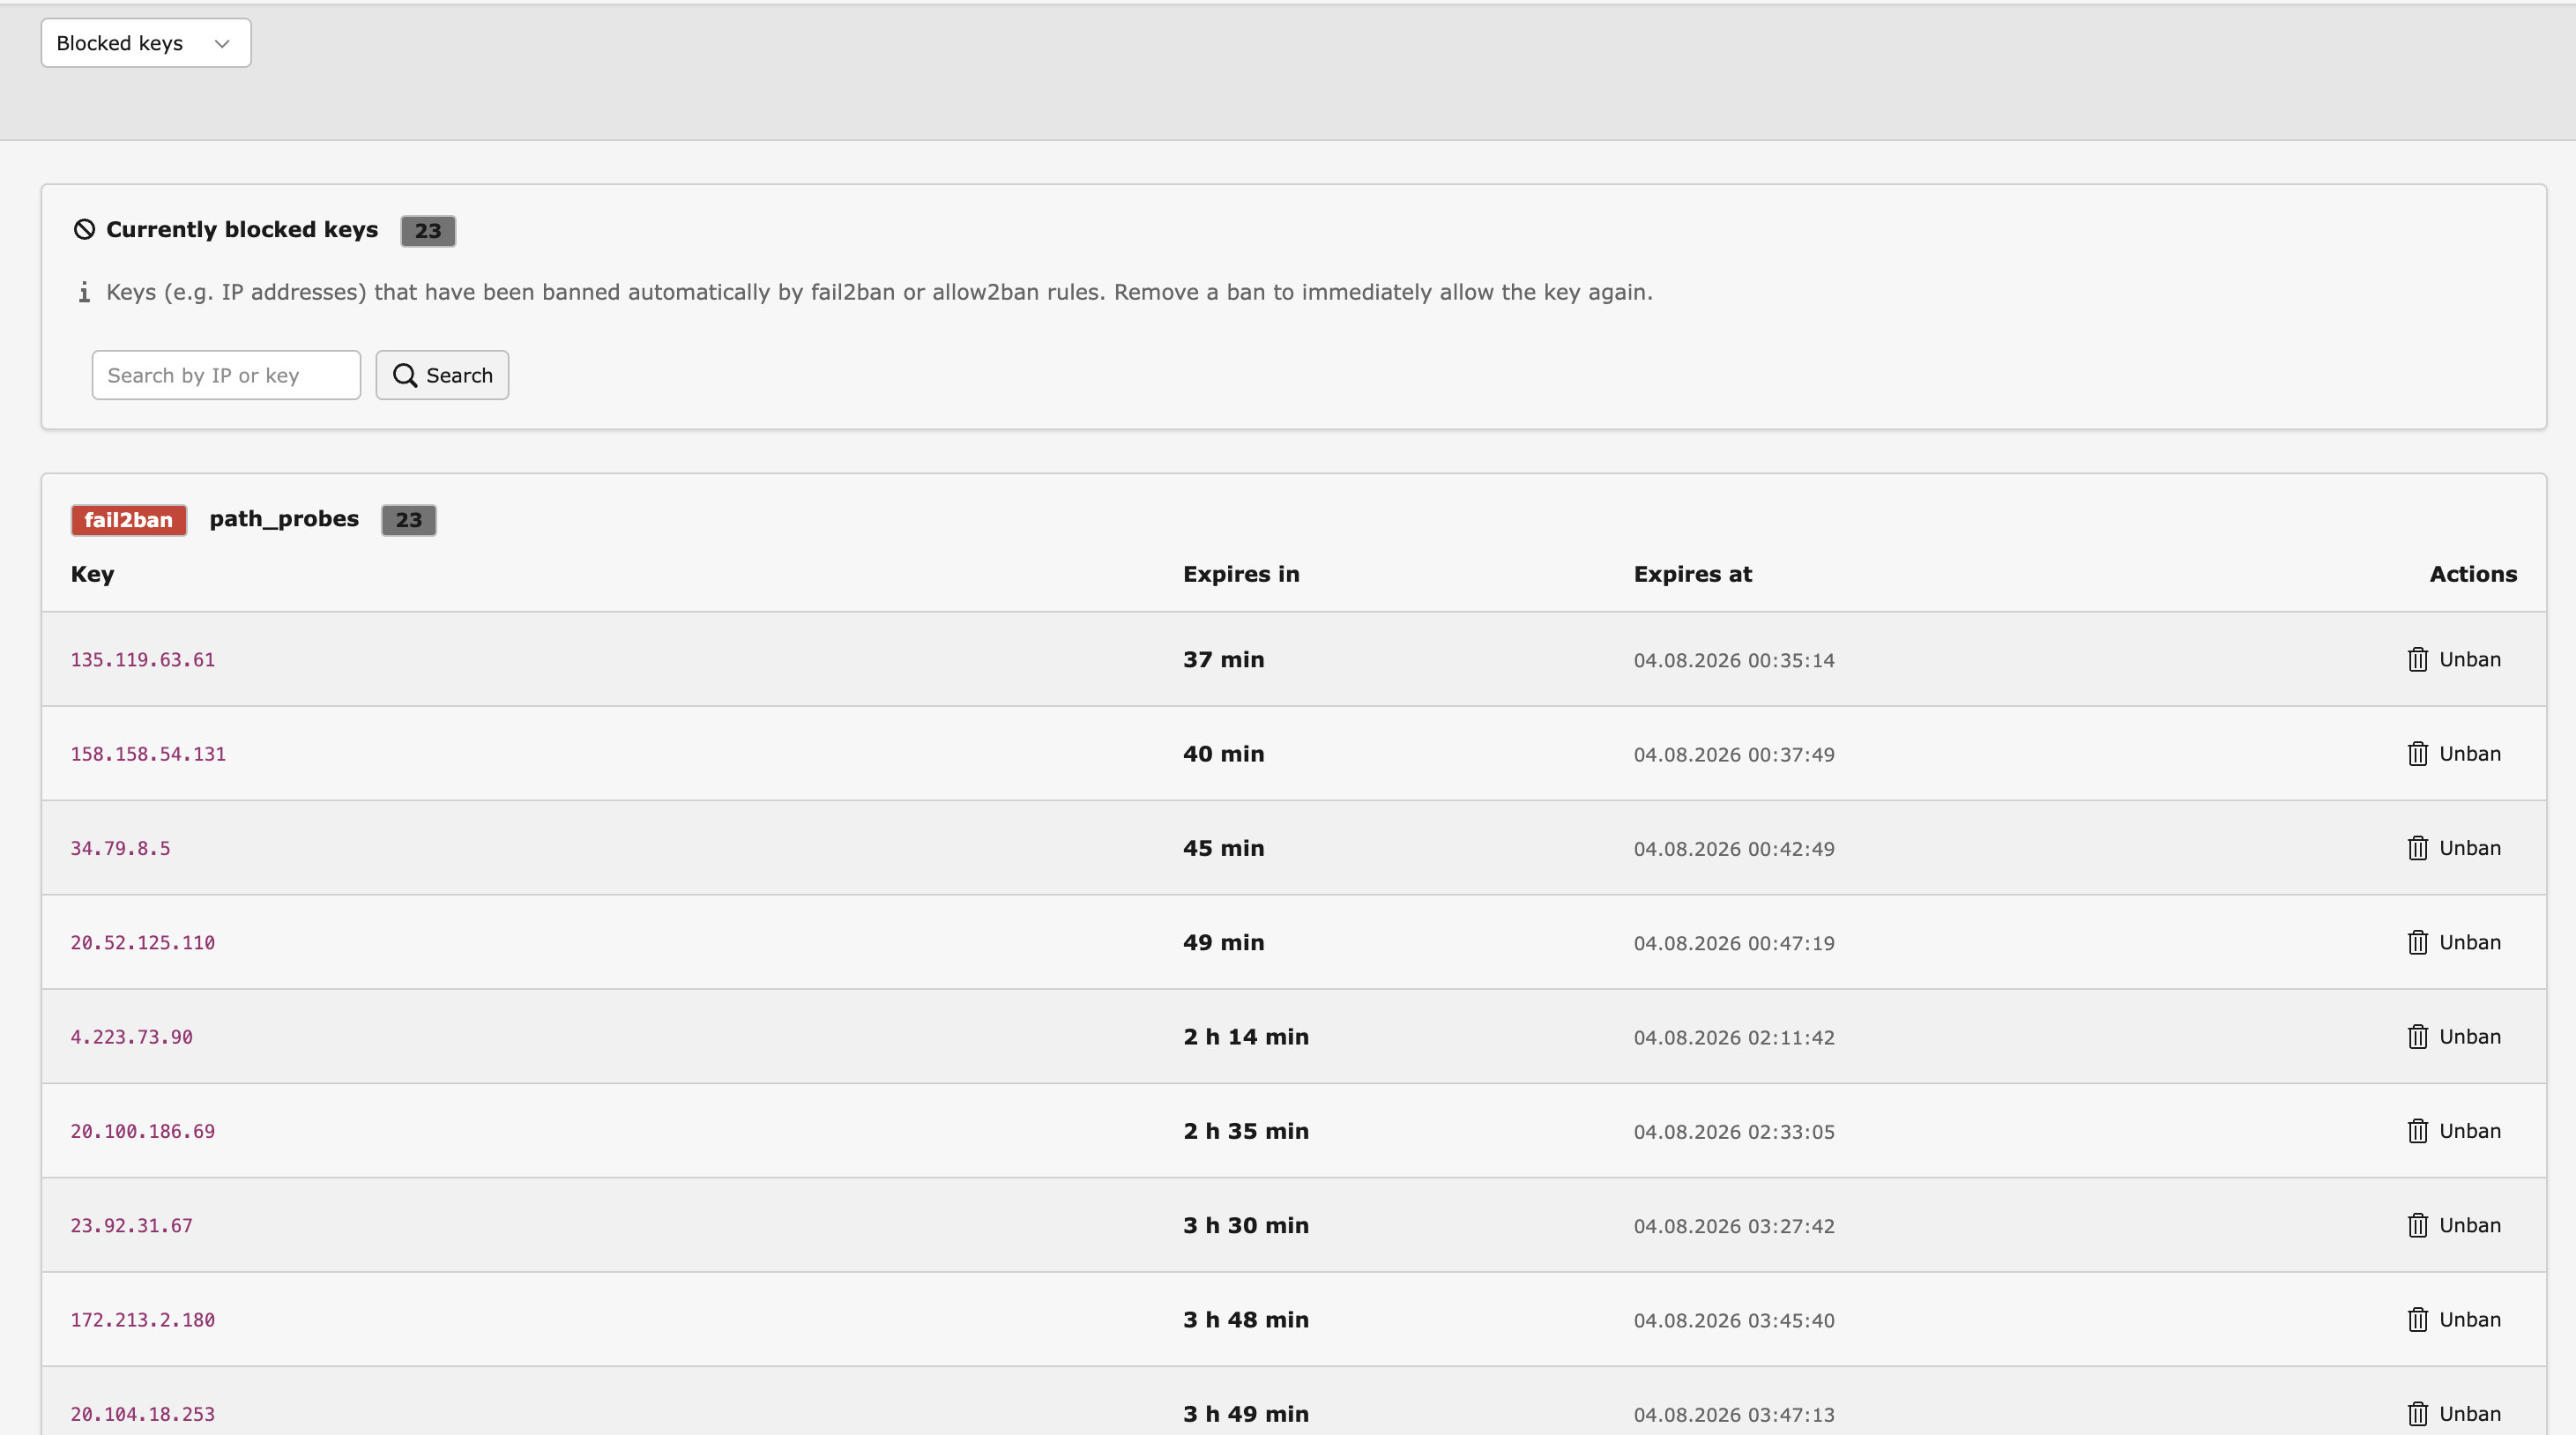
The Blocked keys view: active bans grouped by the rule that created them.
This view lists the keys that fail2ban and allow2ban rules have
banned automatically. A key is usually a client IP address. The bans are
read live from the store that your configuration uses (see Storage),
so the view is empty when you use the InMemoryCache, which keeps no state
between requests.
Bans are grouped by the rule that created them. Each group carries a badge
that shows the rule type, fail2ban or allow2ban. Inside a group every
ban shows the key, the remaining time, and the exact time the ban ends. The
bans with the least time left are listed first. Use the search field to find
a single key across all groups.
The Unban button removes a single ban after a confirmation dialog and lets the key through again right away. When the behavior that triggered the ban continues, the rule bans the key again on the next matching request.
Blocklist matches do not appear here. A blocklist rule answers each matching request with a 403 response on the spot and keeps no ban, so there is nothing to list. To see blocklist activity, use the Event log and the Statistics view.
Event log
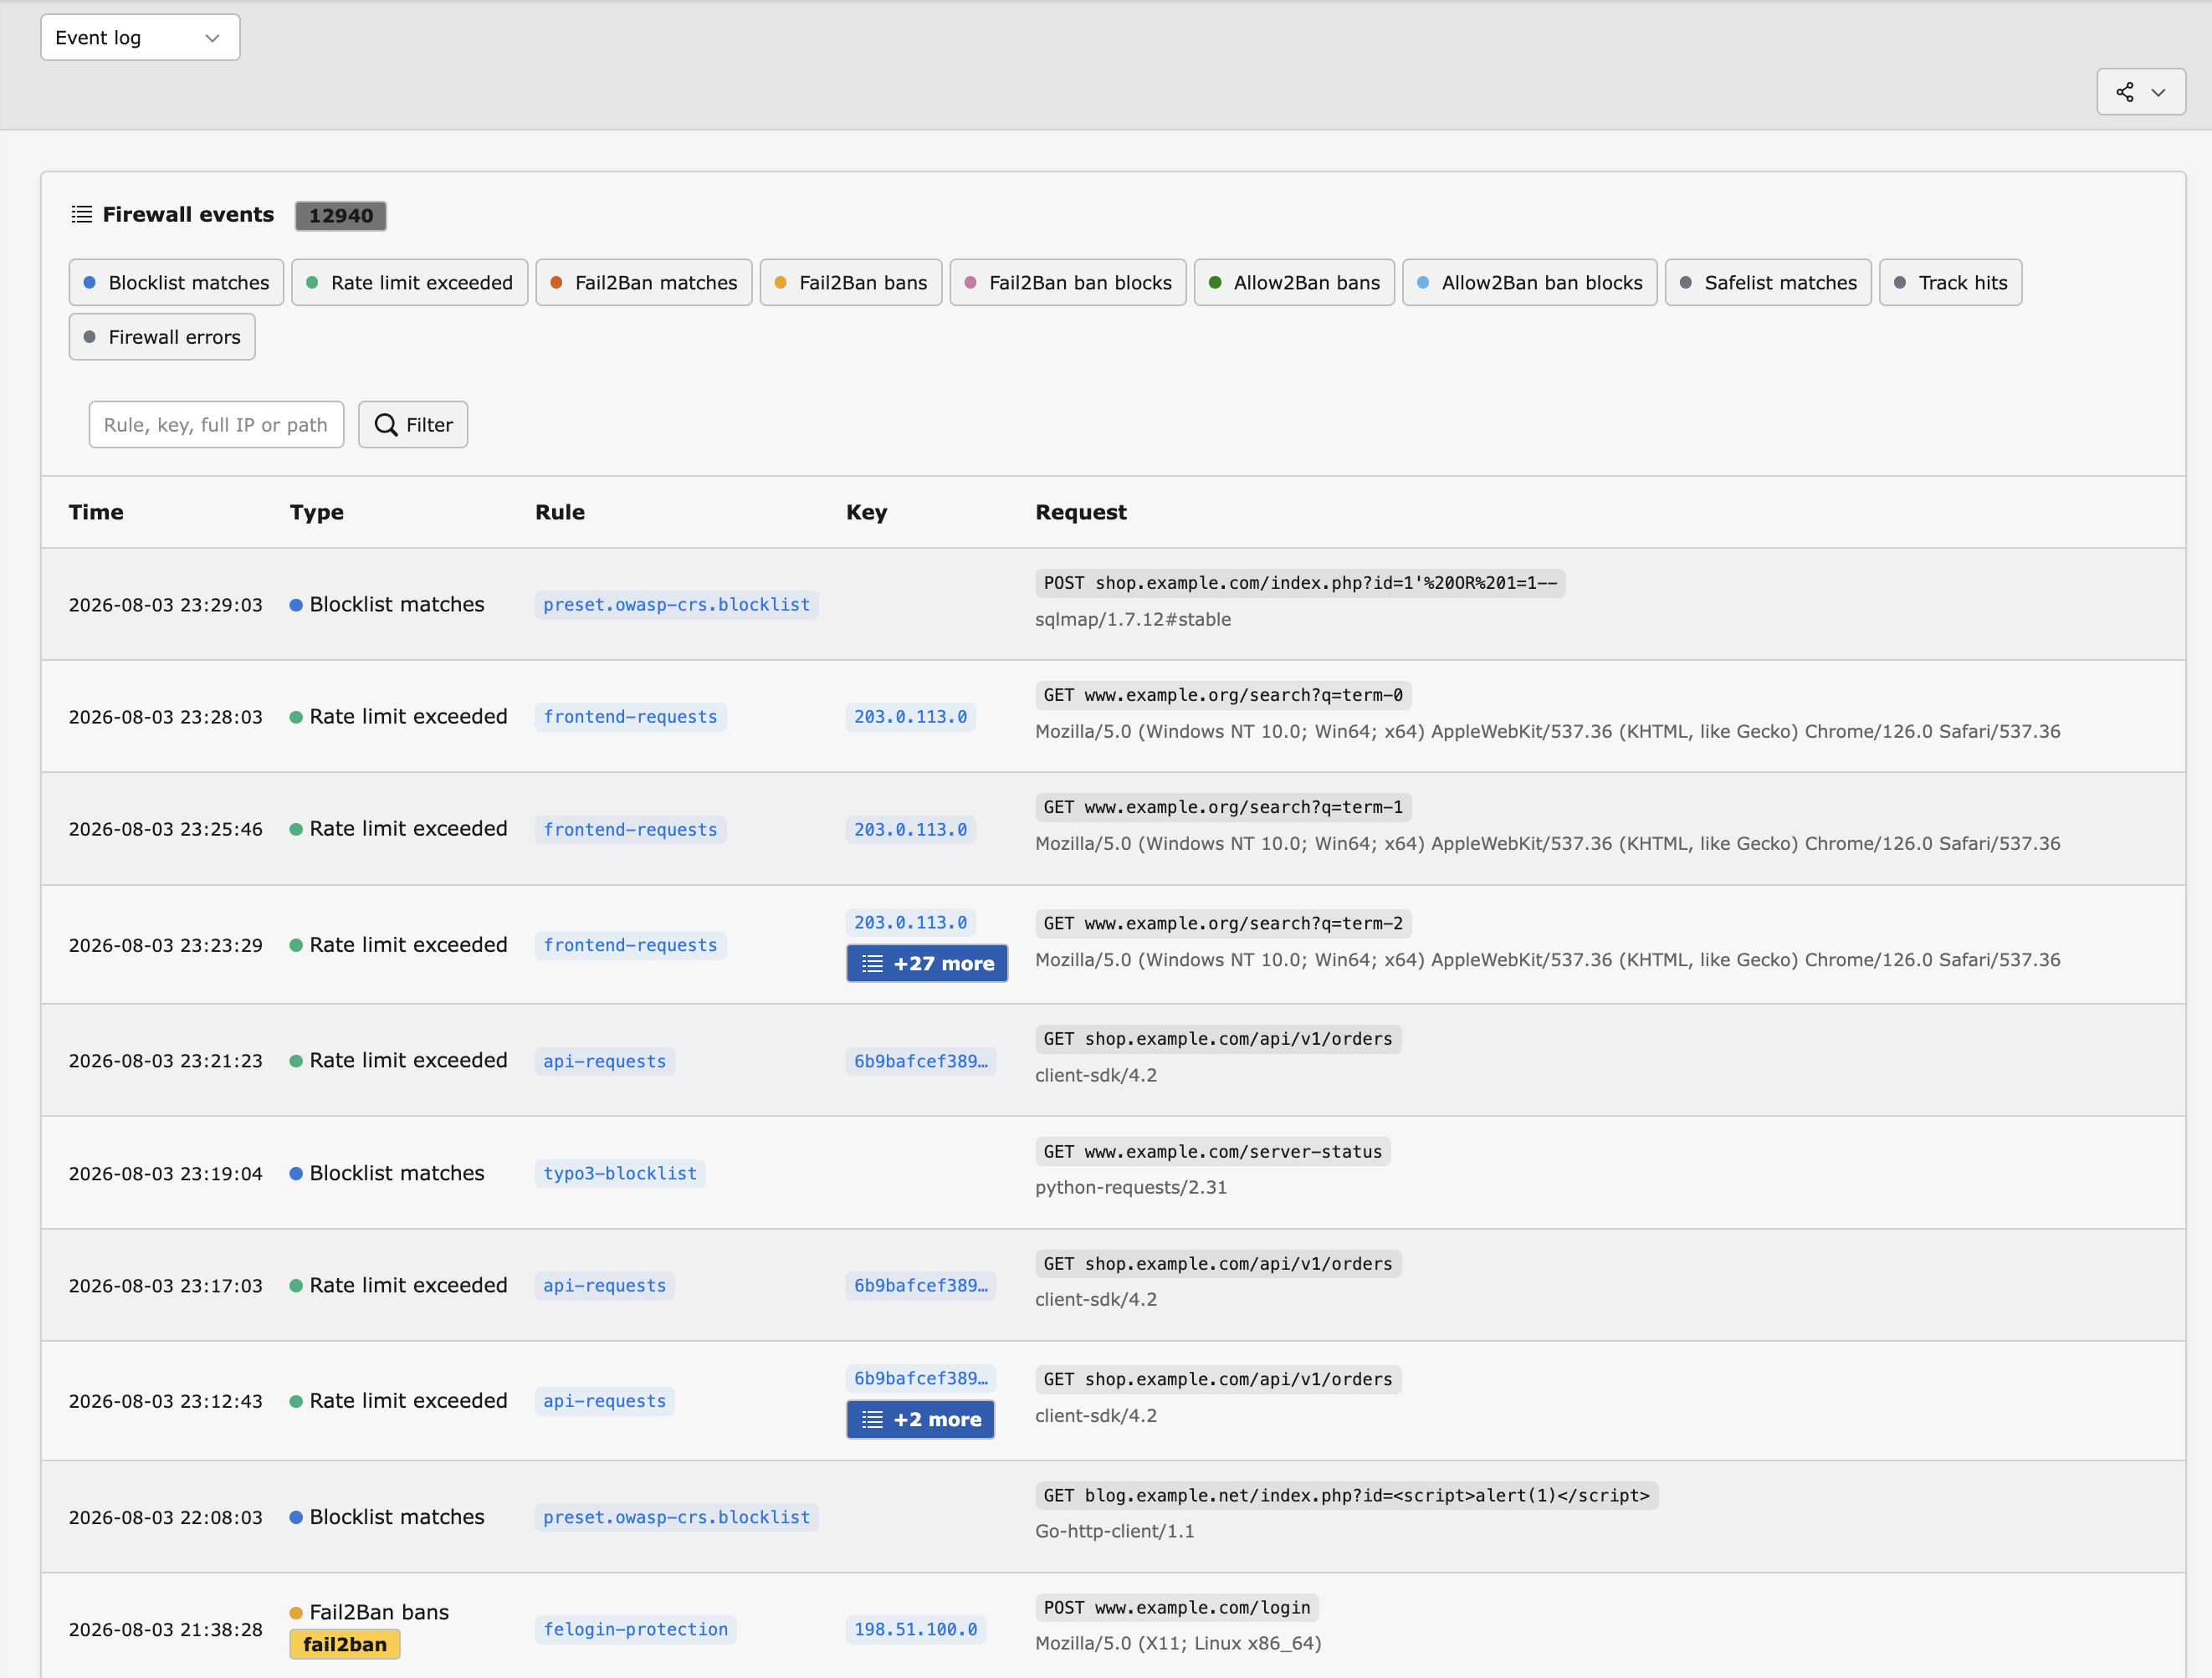
The Event log view: the type tags, the active key filter, and the search field above the event table.
This view lists the latest recorded firewall events, newest first. Every entry shows the time, the event type, the rule, the key (an anonymized IP address, or a hash for sensitive keys), an actions column, the request line with the user agent, and the event details. The request line contains the full request target including the query string, so GET payloads such as injection attempts are visible (and searchable) as they arrived.
The details column renders everything the event carried as key: value
lines: the counters of the rule that fired (threshold, count,
banSeconds) and the metadata the matcher attached to its match. For an
OWASP CRS match that is the rule id, its message (msg), the matched
target (owasp_matched_variable, for example
REQUEST_HEADERS:User-Agent) and the value the rule fired on
(owasp_matched_value) - readable, so the match can be understood and
tuned; the matcher redacts credential values (cookies,
Authorization-type headers) before they reach the log. Submitted POST
parameters are not stored; the log records only what led to the match. The
diagnostic headers appear as `diagnostic` response headers, so
you can inspect which rule fired without exposing that information to
clients.
With the eventLogRequestHeaders extension setting enabled, every event
also records the request headers, shown collapsed behind their own details
element in the request column - the full picture of how a request arrived.
Credential headers are stored redacted; see Statistics for the
privacy notes. And while eventLogFullIpRules lists rules whose events
store the client IP unanonymized for an ongoing attack analysis, a warning
icon appears in the view's header - a click shows the affected rules - and
the System > Status report warns as well.
When a client triggers many events, the list collapses them: each key shows only its three newest events, and the third row carries a hint with the number of older events. Events without a key, for example blocklist matches, are never collapsed. The filter button in the actions column - a plus overlay marks it - filters the list to that key and shows every one of its events; in the filtered view it turns into a remove-filter button with a minus overlay. The hint on a collapsed key opens the same filter. The rule is clickable and filters the list to the events of that rule; both filters combine with the tags and the search. Every active filter appears above the list and is removed again with the close button next to it.
The view covers the last seven days by default; the range buttons in the header switch between 24 hours, 7 days, 30 days, and the whole log. A bounded range also keeps the view fast on large event tables.
A lock icon next to a key means the key is blocked right now: an active
fail2ban or allow2ban ban, or a matching ip or cidr entry on the
pattern blocklist. The icon's tooltip names
the source, for example the banning rule. The check works for every banned
key, including hash-only keys; for cidr entries with an anonymized key
it is limited to networks at least as coarse as the anonymization mask
(/24 for IPv4, /64 for IPv6).
Keys that are not blocked yet and store the full IP address offer a red
block button next to the key. After a confirmation dialog it creates
an exact ip entry on the pattern blocklist for exactly the address the
row displays; the entry appears in the Patterns view, where it can be edited,
given an expiry, or removed. This requires the full address, so the button
appears with IP anonymization disabled or for events whose rule is listed
in eventLogFullIpRules. Anonymized addresses are not blockable from the
log - the real client IP behind the anonymized network address is unknown -
and neither are keys stored as hash only (for example header or session
based throttle keys), where the clear text needed for a pattern entry does
not exist.
Single keys can also be hidden from the list: the minus button next to the key hides all of its events, for example a noisy monitoring service while inspecting the remaining traffic. Hidden keys appear as chips above the list and can be removed there one by one; up to 20 keys can be hidden at the same time.
Filter the list by event type with the type tags: a click toggles a tag,
and all active tags combine into one filter. Only event types that actually
occur in the log are offered as tags, plus any filter that is currently
active, so a stored filter can always be toggled off. When the log still
contains entries older than the configured retention period, the view shows
a warning: the firewall:eventlog:prune console command is not running
regularly and should be scheduled (TYPO3 scheduler or cron). The active tags, the search
term, the hidden keys, and the selected time range are stored per backend
user and restored the next time the module is opened; Reset clears them.
The key filter is a transient drill-down and is not stored. The search field matches rule names, keys, and request
paths. It also compares the search term against
the stored key hash, so searching for the full IP address (for example
203.0.113.10) finds its events even when the list only displays the
anonymized form 203.0.113.0. The list is paginated with 50 entries per
page; the pager keeps the active filters. See Statistics for the
retention settings of the underlying log table.
Statistics
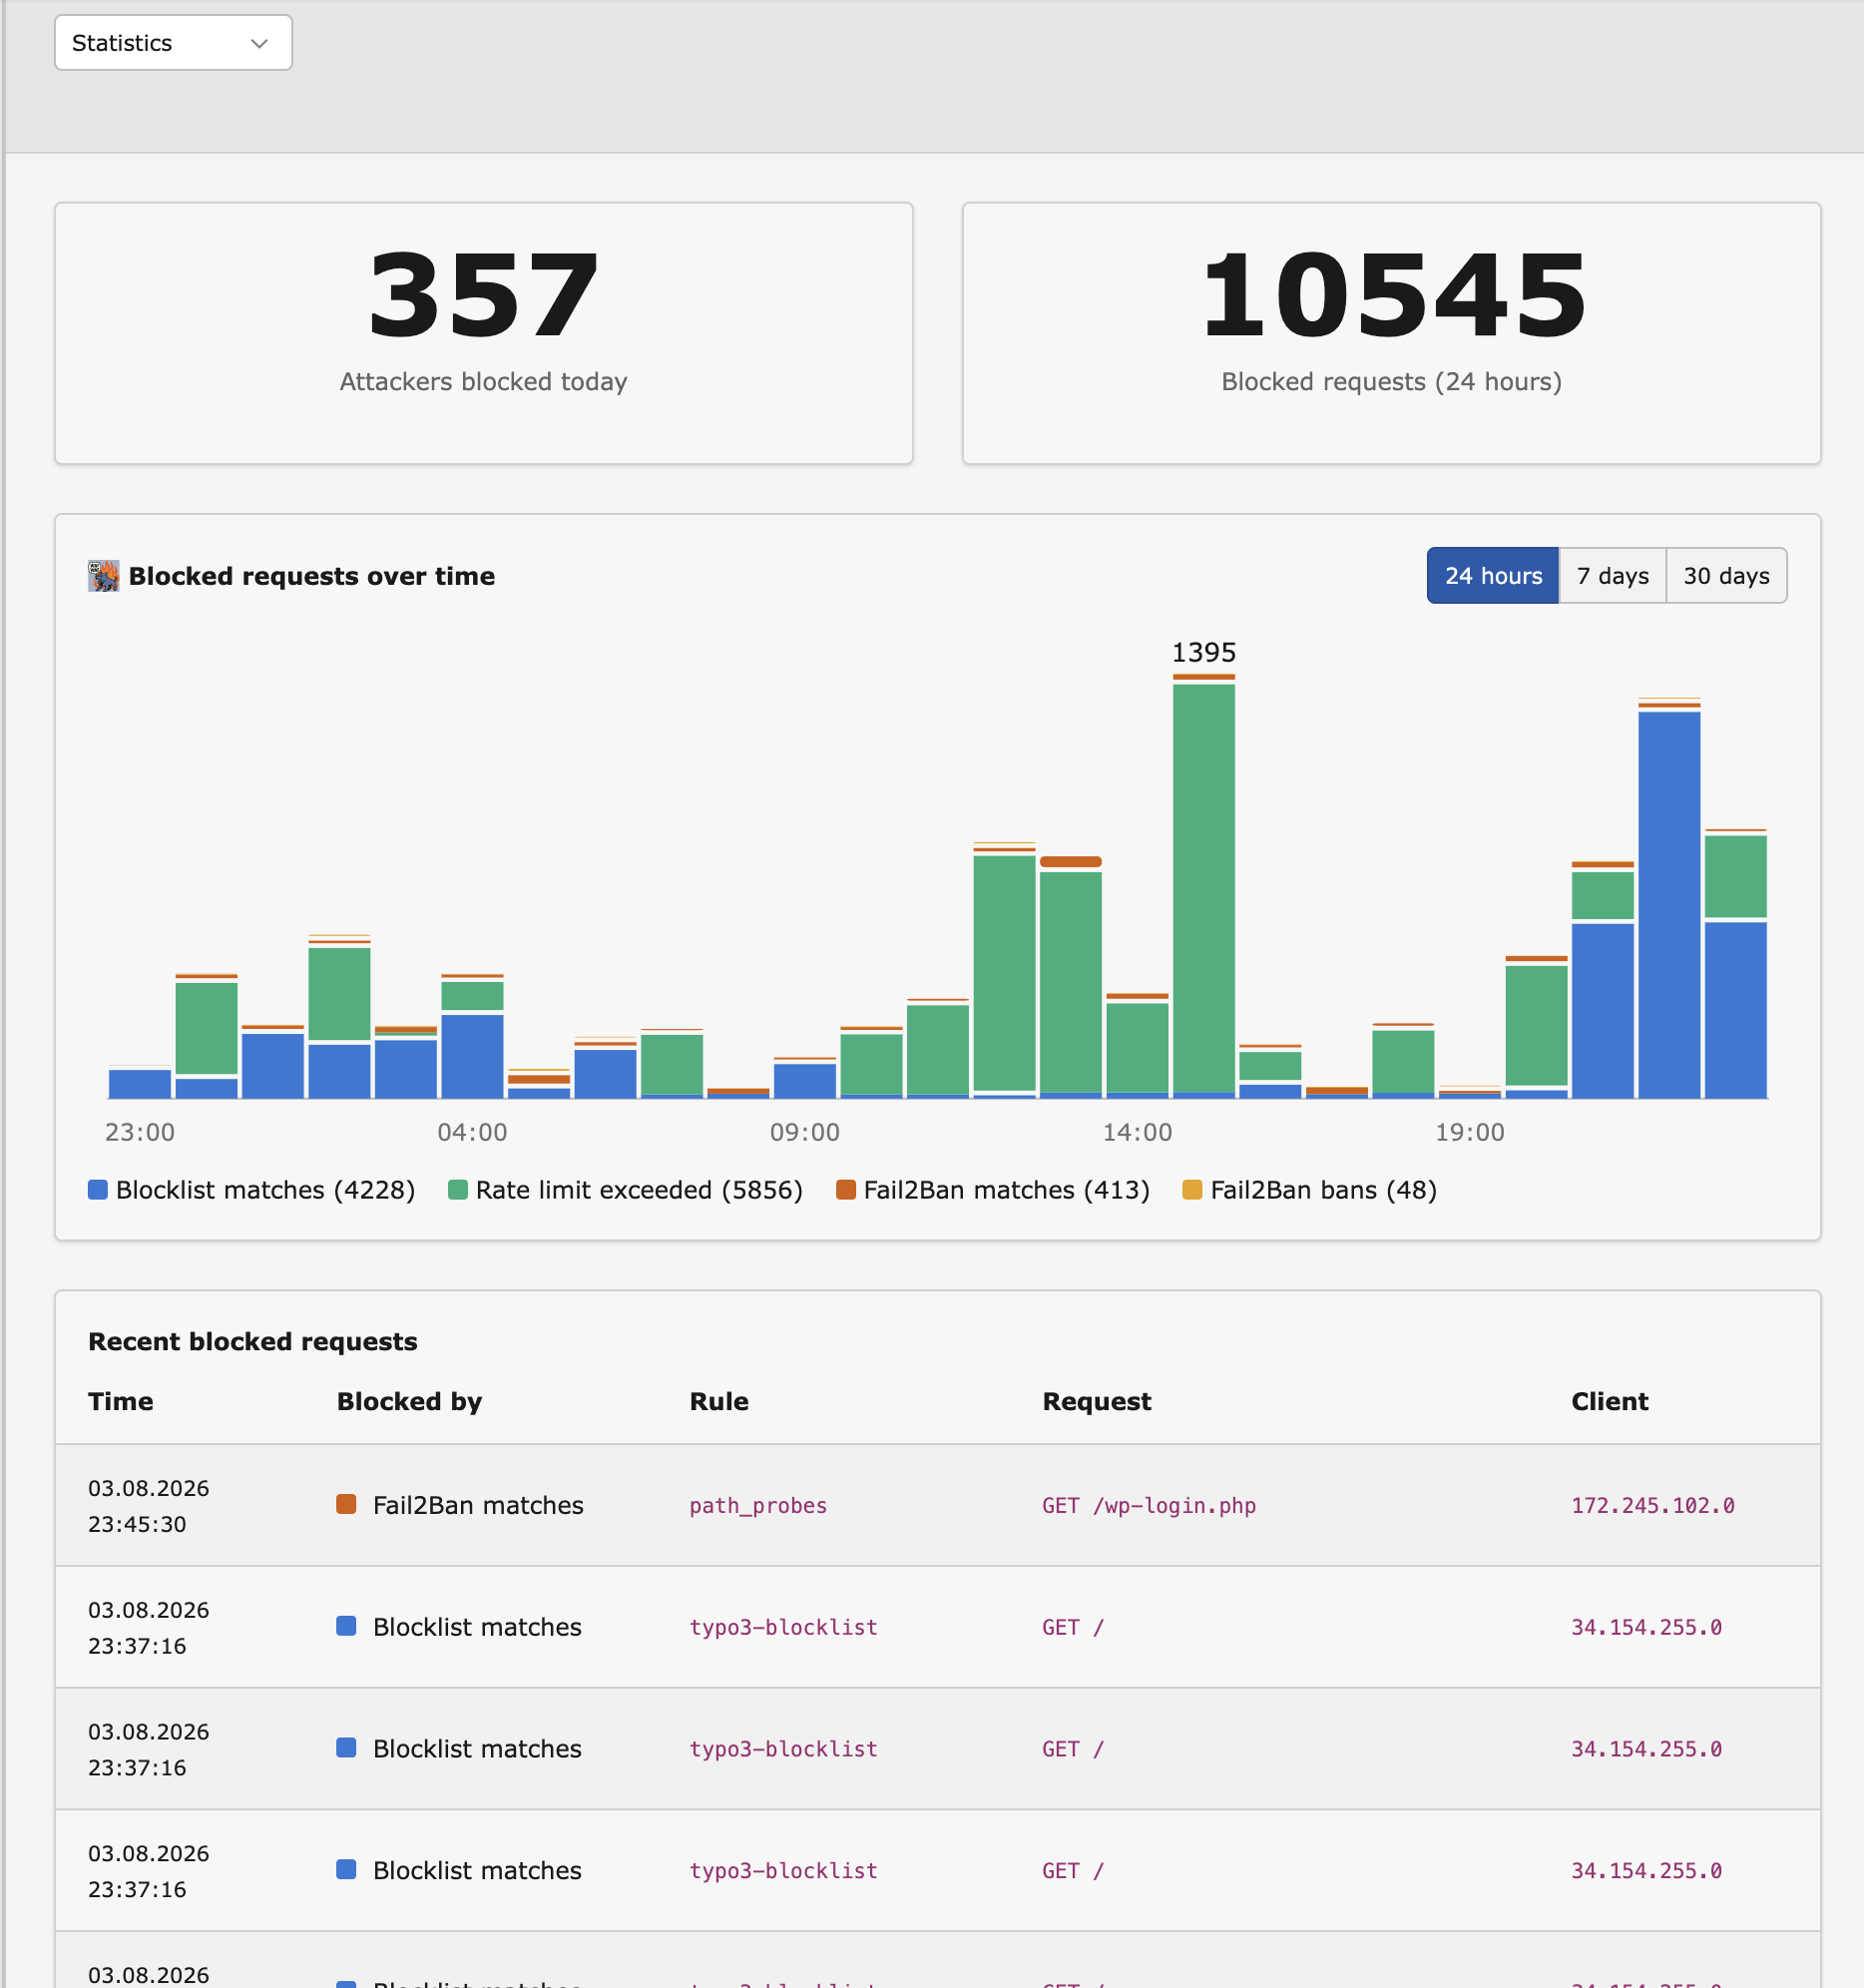
The Statistics view: the blocked-requests chart over time and the top lists below it.
This view answers one question: how much unwanted traffic the firewall blocked. It shows the number of attackers blocked today, a chart over time, and the rules and paths that triggered most often. For the full description of the recorded data, the privacy model, and the extension settings, see Statistics.