Integrate TYPO3 Analytics into your TYPO3
backend. Register sites, monitor analytics status, and open the dashboard —
all without leaving the TYPO3 backend.
Introduction
Learn what TYPO3 Analytics offers and what the extension provides.
Installation
Install the extension via Composer and activate it in TYPO3.
Configuration
Configure dashboard periods and development options via the
Extension Manager.
For editors
Learn how to use the Analytics backend module, dashboard widgets,
and the Page Performance Bar.
TYPO3 Analytics is a web analytics service built for TYPO3. This extension
integrates it directly into the TYPO3 backend, so editors and administrators
can access analytics data without switching to a separate tool.
Note
After the free trial period, a paid subscription is required. Available
plans and pricing are shown directly in the backend module and at
analytics.typo3.com.
What the extension provides
The extension adds a Sites → Analytics module to the TYPO3 backend.
For each configured TYPO3 site it provides:
Registration
Enter an e-mail address to register the site with the TYPO3 Analytics API.
The tracking code is then automatically injected into every frontend page.
Status display
Shows the current registration status, website ID and API key.
The status is cached and can be refreshed manually.
Dashboard
Opens the TYPO3 Analytics dashboard as an embedded iframe inside the
TYPO3 backend.
Dashboard widgets
Four widget types for the TYPO3 dashboard — Traffic Graph, Site
Performance, Top Pages, and Traffic Sources — give editors an at-a-glance
view of their site's analytics directly on the dashboard.
Page Performance Bar
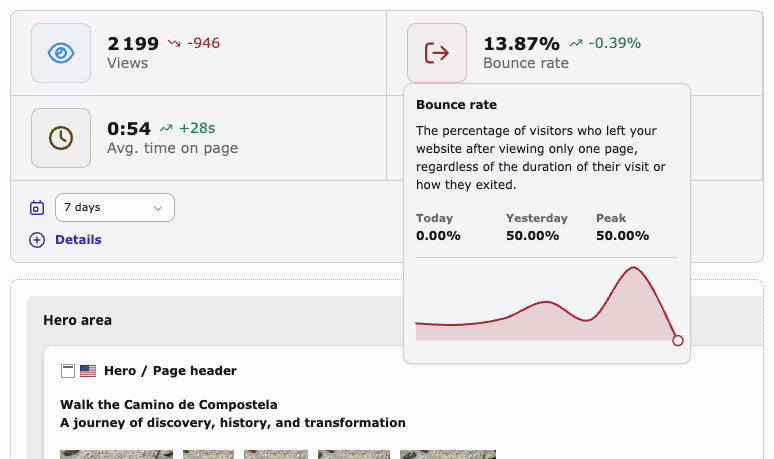
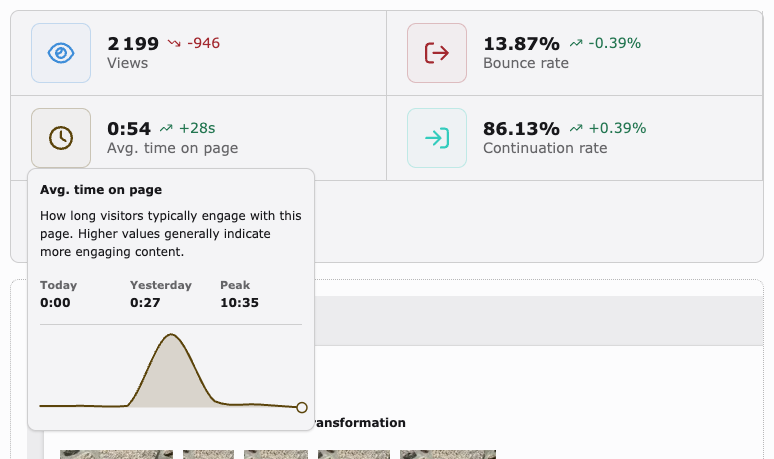
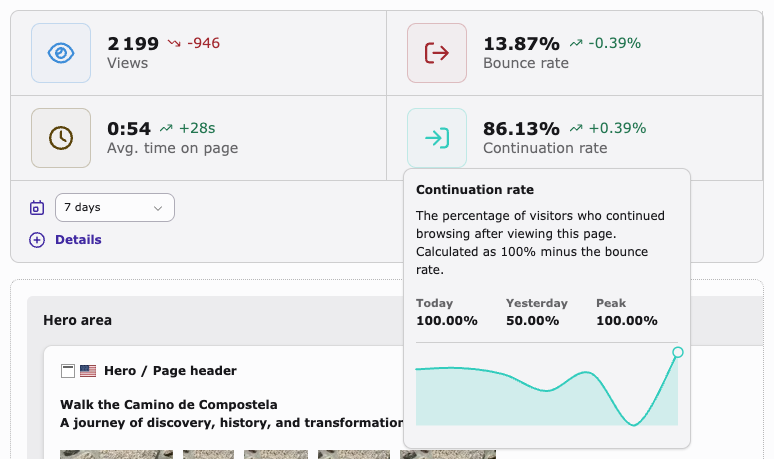
An analytics bar above the page layout in the Page module shows
per-page metrics such as page views, bounce rate, and average time on page.
Requirements
Component
Version
PHP
^8.2
TYPO3
^13.4 or ^14.0
libsodium
PHP extension (bundled since PHP 7.2)
Installation
Install via Composer
composer require t3g/analytics
Copied!
Activate the extension in the TYPO3 Extension Manager or via the CLI:
vendor/bin/typo3 extension:setup analytics
Copied!
Install via TER (Classic mode)
In a non-Composer TYPO3 installation, search for analytics in
Admin Tools → Extensions and install it from there, or download it
directly from the TYPO3 Extension Repository. Make sure the
Dashboard system extension is active before installing, as the extension
depends on it.
Deployment note
Site-specific data written by the extension (credentials, tracking code, API
keys) is stored in each site's config/sites/<identifier>/settings.yaml.
This file is separate from the structural config.yaml and contains
sensitive values that must not be committed to the repository. In a
deployment setup, settings.yaml should be kept in a shared folder
outside the release directory and symlinked or copied on each deploy.
Configuration
The following settings can be configured in the TYPO3 Extension Manager under
Admin Tools → Settings → Extension Configuration → analytics.
They can also be set programmatically in config/system/additional.php:
Comma-separated list of period options (in days) available in all
dashboard widget dropdowns and the Page Performance Bar. Must be
positive integers.
dashboardDefaultPeriod
dashboardDefaultPeriod
Type
int
Default
7
Pre-selected period (in days) for all dashboard widgets and the Page
Performance Bar. Must be one of the values defined in
dashboardPeriods.
pageAnalyticsCacheTtl
pageAnalyticsCacheTtl
Type
int
Default
3600
Lifetime in seconds for all analytics data caches (page metrics,
top pages, site performance, traffic graph, traffic sources, and plans).
Increase this value to reduce API calls on high-traffic backend
installations.
demoData
demoData
Type
bool
Default
0
When enabled, replaces all analytics API calls with static demo data.
Only takes effect in the TYPO3
Development
application context.
Use this to explore the widgets and module without a live analytics
account.
The extension ships a ready-made Analytics Overview dashboard preset that
can be selected when creating a new TYPO3 dashboard. It pre-populates the
dashboard with all four widget types:
Traffic Graph
Site Performance
Top Pages
Traffic Sources (Channel, Devices, Browser, Countries — one widget each)
Select Analytics Overview in the dashboard creation wizard to get started
immediately.
Backend module
The Sites → TYPO3 Analytics module provides an overview of all configured
TYPO3 sites and their analytics status. Sites are grouped into Active sites
and Inactive sites.
Plans
At the top of the module, available subscription plans are displayed with
pricing and feature comparison. The toggle switches between monthly and yearly
billing. Plans and pricing are fetched live from the TYPO3 Analytics API.
Site cards
Each site is shown as a card with the following information:
Site title and identifier
Domain
Current status (active, pending, inactive, or cancelled)
Website ID and API key (once registered)
Subscribed package and expiry date
Credit usage and reset date
Active sites additionally show:
A Dashboard button that opens the analytics dashboard as an
embedded iframe inside the TYPO3 backend
A Manage Plan link for upgrading or changing the subscription
A Refresh status button to force a fresh status lookup from
the API (bypasses the 24-hour cache)
Note
The Manage Plan link and Refresh status button are
only available to backend administrators and users with the
Analytics Manager custom option. See Access control.
Registration
Sites that are not yet registered show a registration form. Enter an e-mail
address and click Register to connect the site with the TYPO3
Analytics API. Once registration is confirmed, the tracking script is
automatically injected into every frontend page of that site.
Note
Registration is only available to backend administrators and users with the
Analytics Manager custom option. See Access control.
Dashboard
The Dashboard button opens the TYPO3 Analytics web dashboard as
an embedded iframe inside the TYPO3 backend. All analytics data for the
selected site is available here without leaving TYPO3.
Non-manager users are granted a read-only watcher link — they can view the
dashboard but cannot make changes to the analytics configuration.
Dashboard widgets
The extension provides four widget types for the TYPO3 dashboard. Each widget
type is available in a TYPO3 v13 variant (inline dropdowns, AJAX-driven) and a
TYPO3 v14+ variant (native widget settings panel).
All v14+ widgets share two common settings:
Setting
Type
Default
Description
Title
string
(widget default)
Overrides the widget title shown in the dashboard header.
Leave empty to use the default.
Show site & period in title
bool
true
Appends the site name and period in parentheses to the title,
e.g. Traffic Sources (My Site · 7 days).
Traffic Graph
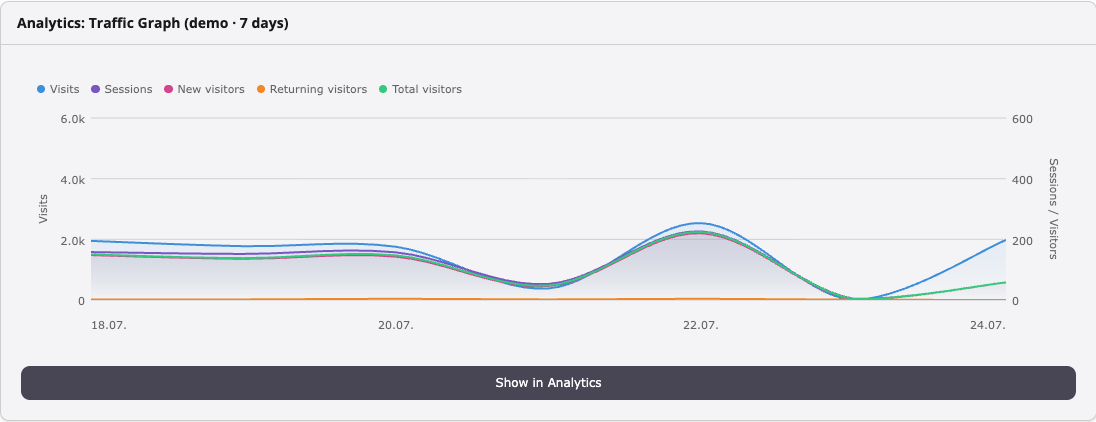
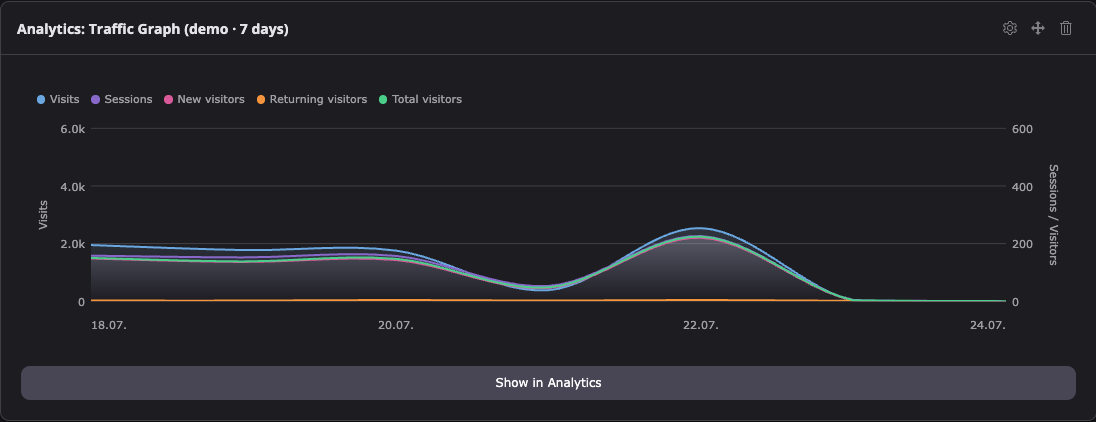
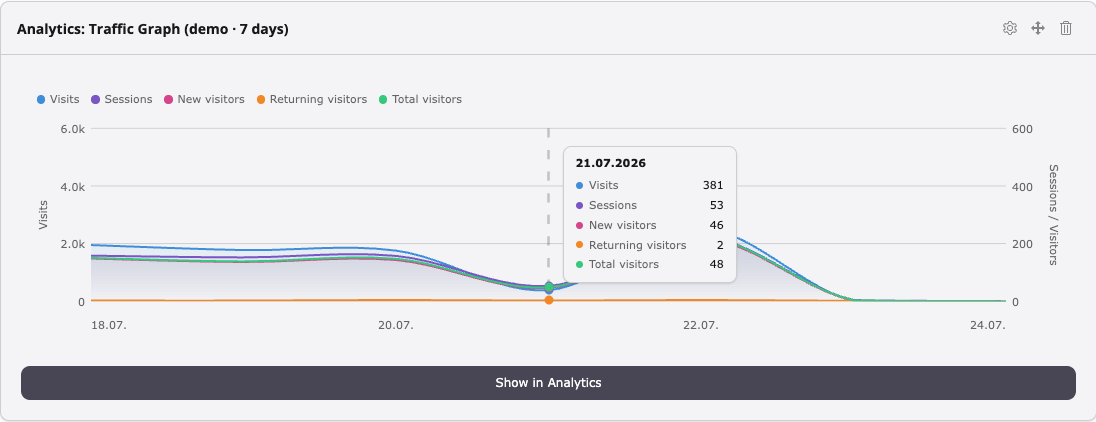
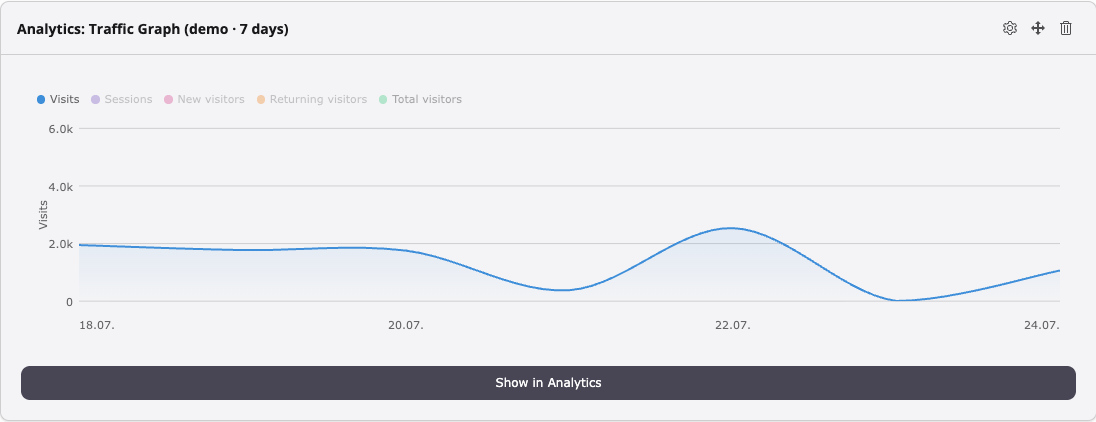
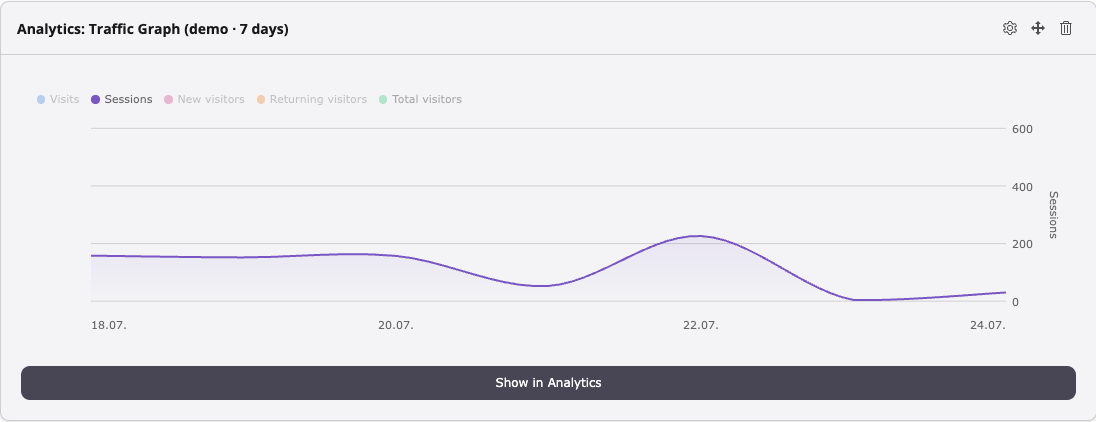
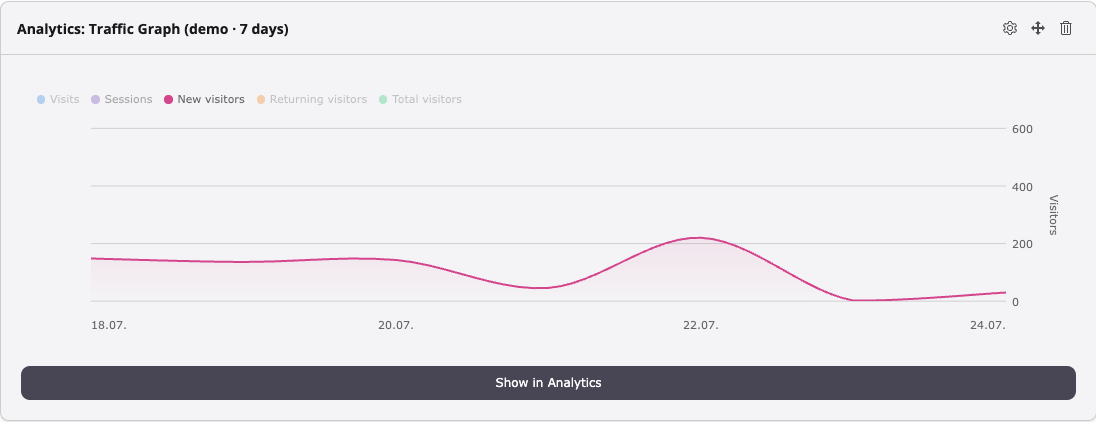
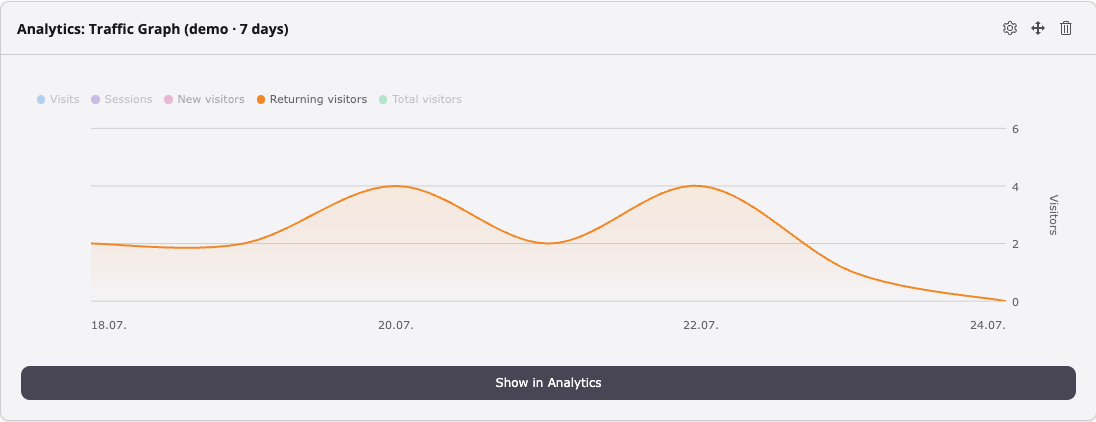
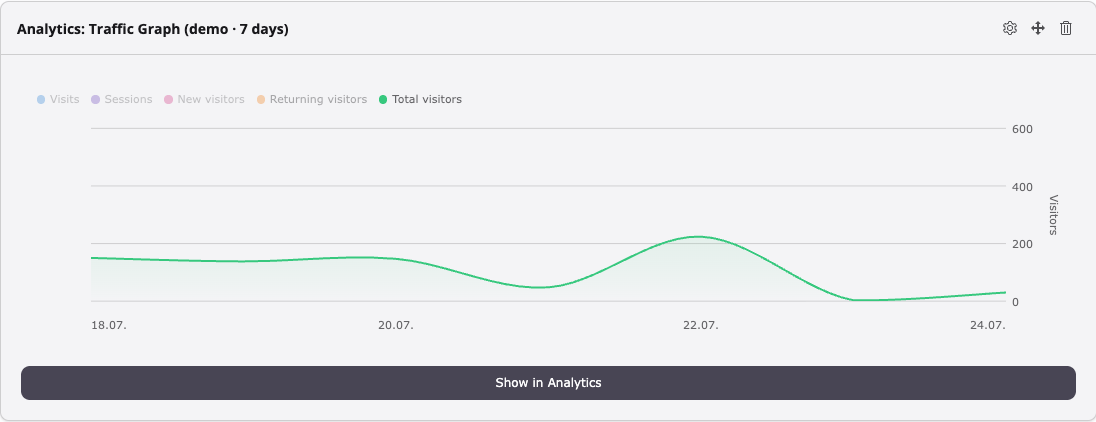
Displays a full-width line chart of daily visit counts for a configured site
over the selected period. A Show in Analytics link opens the main
analytics dashboard.
Each metric in the legend (Visits, Sessions, New visitors,
Returning visitors, Total visitors) can be toggled on and off
individually by clicking its legend button — useful for focusing on a single
data series. The y-axis rescales automatically to the visible data range when
series are toggled. Hovering over the chart reveals a tooltip with exact values
for that date.
Widget settings (v14+): Site, Period (days).
Site Performance
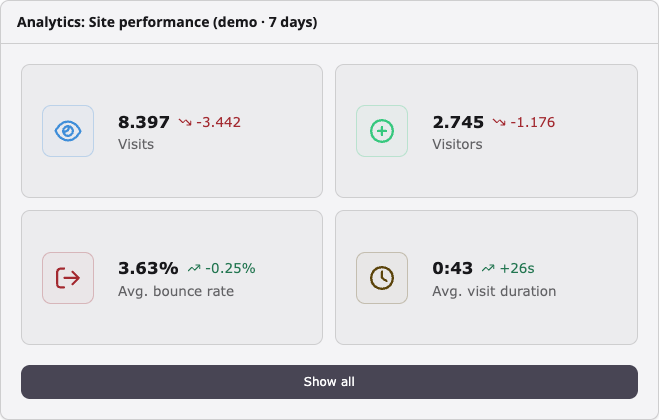
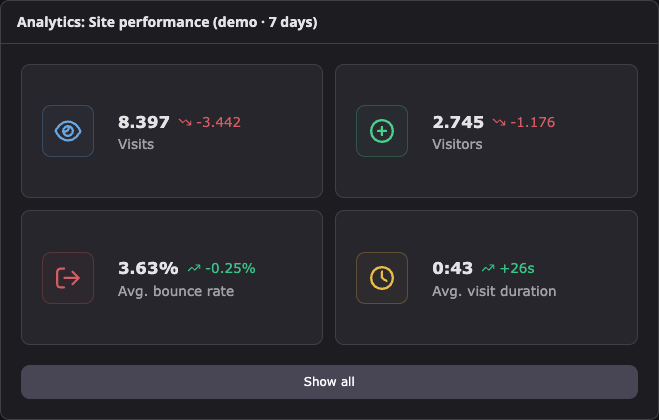
Displays four metric tiles — Visits, Visitors, Bounce rate, and
Avg. visit duration — each showing the current value and a trend arrow
compared to the previous period of equal length. A Show all link
leads to the analytics dashboard.
Widget settings (v14+): Site, Period (days).
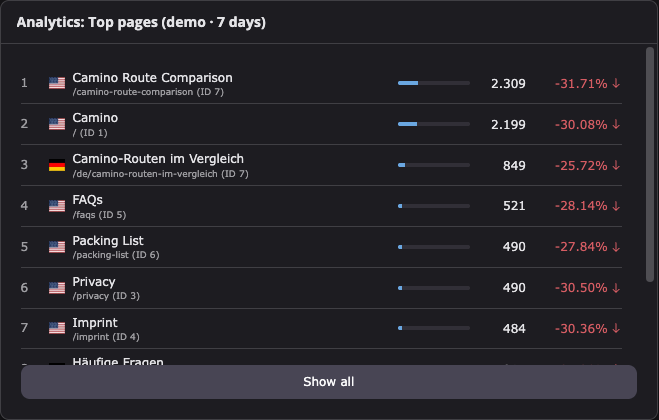
Top Pages
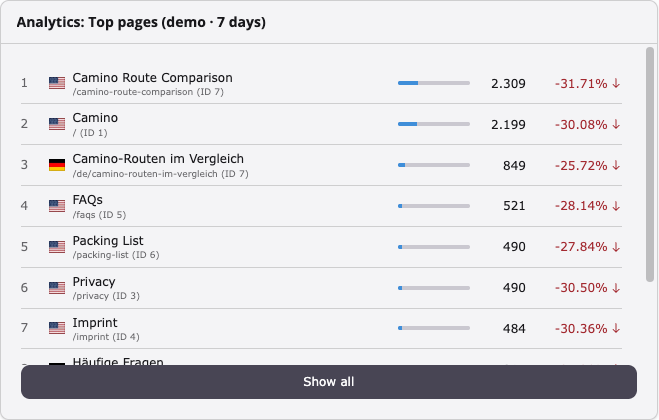
Displays a ranked list of the most-visited pages for a configured site. Each
row shows the page title, URL, and view count. A Show all link
leads to the pages view of the analytics dashboard.
Widget settings (v14+): Site, Period (days), Limit (number of
pages shown).
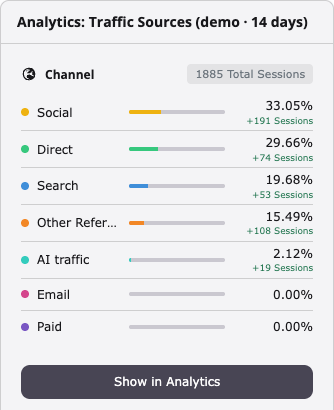
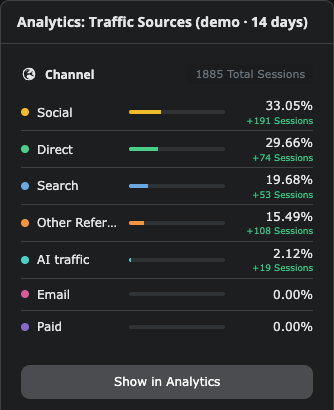
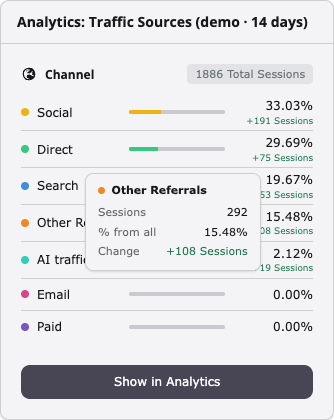
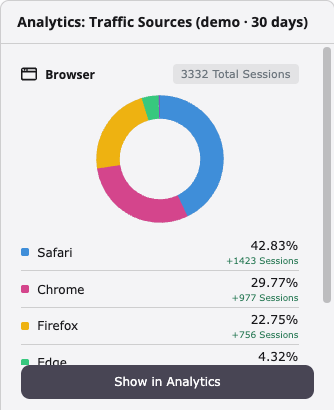
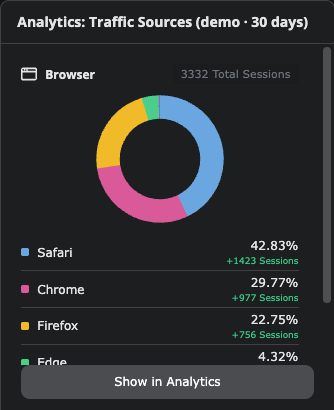
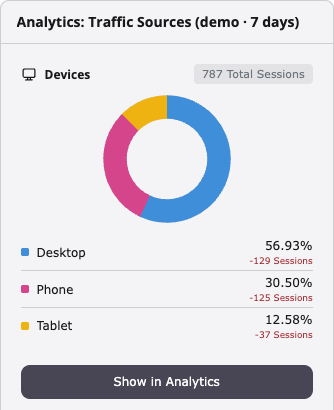
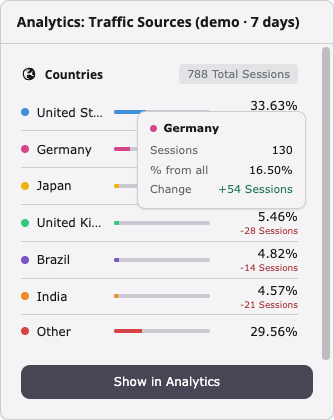
Traffic Sources
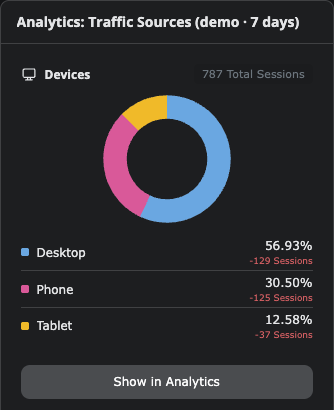
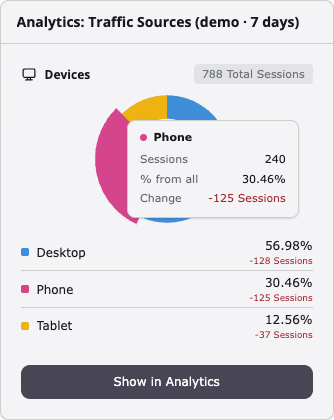
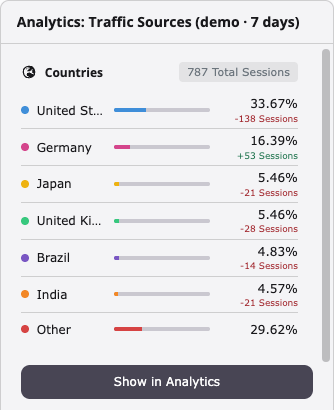
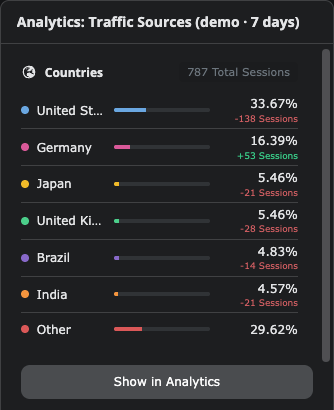
Displays a breakdown of incoming traffic by channel, browser, device type, or
country. Entries outside the top results are aggregated into an "Others" row.
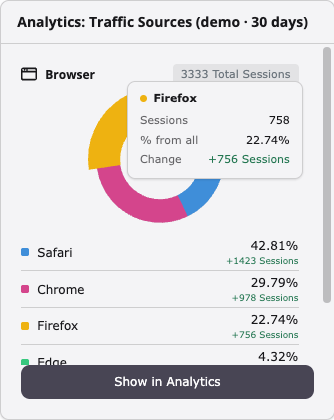
Donut chart variants support hover interaction: hovering over a segment pulls
it out slightly and shows a tooltip with the session count, percentage, and
comparison to the previous period.
On TYPO3 v14+, four separate widgets are registered — one per section:
Widget
Section
Default chart type
Traffic Sources: Channel
Channel
List
Traffic Sources: Devices
Devices
Donut
Traffic Sources: Browser
Browser
Donut
Traffic Sources: Countries
Countries
List
Widget settings (v14+):
Setting
Type
Default
Description
Site
string
first registered site
Site to display data for.
Period
int
dashboardDefaultPeriod
Time window in days.
Chart type
enum
(per widget)
Display as list (progress bars) or donut
(SVG donut chart, top 5 + aggregated "Other").
On TYPO3 v13, all four sections are shown inside a single widget, stacked
vertically. Site and period are selected via inline dropdowns.
Dashboard presets
The extension ships a ready-made dashboard preset called Analytics Overview.
It can be selected when creating a new dashboard via the
Add dashboard wizard and pre-populates the dashboard with all
available analytics widgets:
The preset is a convenience starting point — widgets can be removed, reordered,
or supplemented with other TYPO3 dashboard widgets after creation.
Page Performance Bar
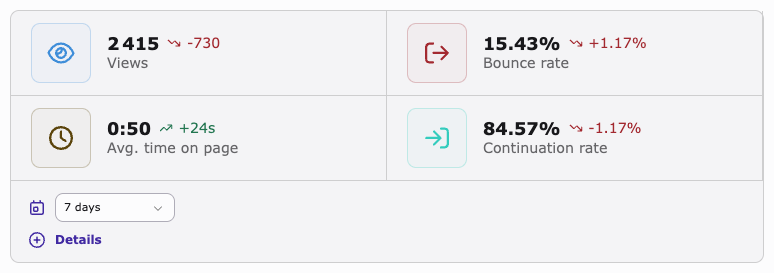
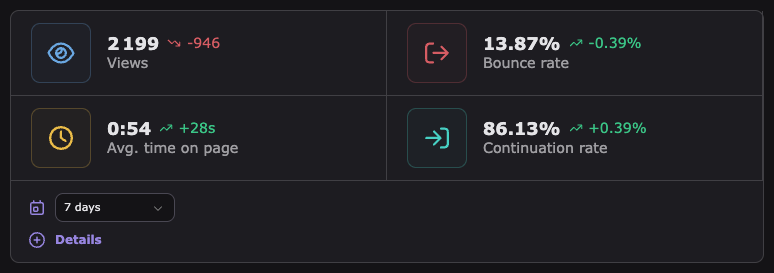
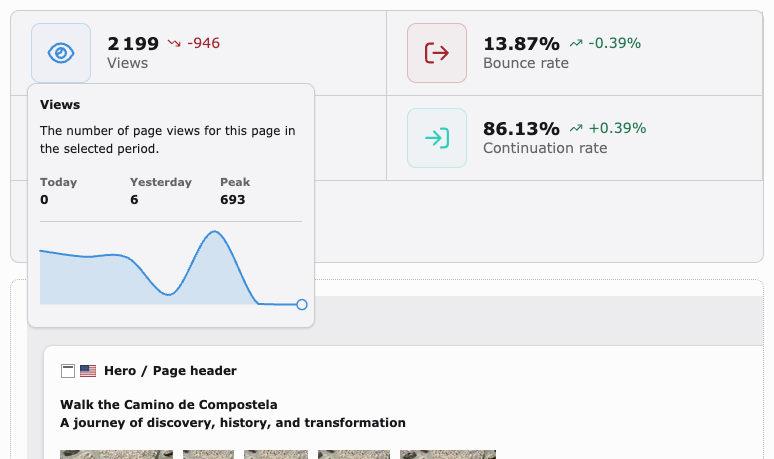
The Page Performance Bar appears above the page content in the
Web → Page module. It shows analytics metrics for the currently
viewed page:
Page views with sparkline and trend vs. previous period
Bounce rate with sparkline and trend
Average time on page with sparkline and trend
Continuation rate (100 − bounce rate) with sparkline and trend
A period selector and a direct link to the full analytics dashboard are
included in the bar.
The bar loads asynchronously — a lightweight skeleton is shown immediately,
and the actual data is fetched via AJAX once the page has loaded. The bar is
hidden in language-comparison mode.
Note
The period selector values come from the dashboardPeriods
Extension Manager setting.
Access control
The Sites → Analytics module is accessible to all backend users. However,
the following actions are restricted to backend administrators and users
who hold the Analytics Manager custom option:
Registering a new site with the Analytics API
Subscribing to or managing a plan
Manually refreshing the registration status
Granting the Analytics Manager option
Open System → Backend Users → Backend Groups, edit the group that
should have manager access, and switch to the Custom Options tab.
Enable Analytics → Analytics Manager.
The TCA value for programmatic assignment is tx_analytics:manager.
The selected period has no recorded visits yet. Try a longer period
(e.g. 30 days), or wait until the tracking script has collected data.
The cached API response does not yet contain data. The cache TTL is
controlled by pageAnalyticsCacheTtl (default: 1 hour).
Tracking script is not injected on the frontend
The tracking script is injected automatically when a site is successfully
registered. If it is missing:
Confirm that registration completed and the site status is active.
A pending or cancelled status means tracking is not yet live.
Make sure no caching layer (reverse proxy, CDN) is serving a stale page
that was cached before the site was registered.
Registration fails or returns an error
Only backend administrators and users with the Analytics Manager custom
option can register sites. See Access control.
Verify that the server can reach the TYPO3 Analytics API. Firewall rules or
outbound proxy configurations may block the request.
Check Admin Tools → Log for the specific API error returned.
"Access denied" flash message in the backend module
The action requires the Analytics Manager permission. Grant it by opening
System → Backend Users → Backend Groups, editing the relevant group,
switching to the Custom Options tab, and enabling
Analytics → Analytics Manager.
See Access control for the full list of restricted actions.
Page Performance Bar does not appear
The bar is only shown in the Web → Page module when a single
language is selected. It is hidden in language-comparison mode (when
multiple languages are displayed side by side).
The bar loads asynchronously. If the page module loads but the bar never
appears, open the browser developer tools and check the network tab for a
failed AJAX request.
Confirm the site is registered and its status is active.
Dashboard iframe is blank or shows an error
The iframe URL is retrieved from the TYPO3 Analytics API on each request.
If the API is unreachable, the iframe cannot be loaded. Check
Admin Tools → Log for API errors.
Non-manager backend users receive a read-only dashboard link. This is
expected behaviour — they can view data but cannot change settings.
Tracking has stopped / credits exhausted
When a site's credits are used up, tracking stops immediately — no further
visits are recorded until the credit balance resets or the plan is upgraded.
The backend module shows a warning on the affected site card.
Check the credit usage displayed on the site card.
Use the Manage Plan link to upgrade the subscription or wait
for the monthly credit reset (the reset date is shown on the site card).
Use the Refresh status button to fetch the current credit
balance bypassing the 24-hour cache, for example to check whether a reset
has already occurred.
Demo data does not appear
The demoData setting only takes effect when the TYPO3 application
context is Development. If demo data is enabled but the context is
Production or Testing, the extension falls back to real API calls —
which means no data is shown if the site is not yet registered or has no
recorded visits.
Verify the application context is set to Development, for example by
checking the web server environment variable TYPO3_CONTEXT.
Further assistance
If your issue is not covered above, contact the TYPO3 Analytics support team
at support@typo3.com.
Changelog
1.0.5
[BUGFIX] ext_emconf (revert changes from before)
1.0.4
raise version (TER upload failed before)
1.0.3
Fix ext_emconf.php by @josefglatz in #17
[TASK] Update ignore rules in .gitattributes by @eliashaeussler in #18
[BUGFIX] detect and surface site settings write failures by @sfsmfc in #20
1.0.2
replace links to documentation with its permalinks
Improvement: When opening the dashboard with a page filter (e.g. from
the Page Performance Bar), all widgets are now shown instead of only
page-specific ones.
0.10.1
Bugfix: Plan pricing now loads correctly against password-protected API
environments (e.g. staging). HTTP Basic Auth credentials were missing from
the fetchPlans() request, causing silent 401 errors and an empty
pricing overview in the Analytics backend module.
Improvement: Default contact email changed from support@typo3.com
to analytics@typo3.com.
0.10.0
Feature: The plan selection page now loads dynamically via AJAX and
supports toggling between monthly and yearly billing. Plans are sorted by
credit volume.
Improvement: Verified and extended TYPO3 v14 compatibility — CI now
runs against TYPO3 v13, v14, and v15 (dev-main).
0.9.15
Documentation: TYPO3 RST documentation added — covers all dashboard
widgets, the Page Performance Bar, configuration reference, installation,
access control, and a dashboard preset overview. Includes light/dark mode
screenshots and hover-tooltip galleries for all widgets.
Improvement: Extended German (de) translation — widget settings,
chart labels, Traffic Sources section titles, dashboard preset, and
access control strings are now fully translated.
0.9.14
Bugfix: Fixed missing AJAX loading in the Traffic Graph widget on TYPO3 v14.
0.9.12
Feature: Dynamic y-axis rescaling in the Traffic Graph — the axis adjusts
automatically to the visible data range.
Feature: Legend items in the Traffic Graph are now clickable and toggle
the corresponding data series on and off.
Feature: Traffic Sources donut chart now has a pull-out hover effect for
individual segments.
0.9.11
Improvement: Top Pages widget now shows the page slug, language flags,
and coloured tooltips. Page URLs are now absolute.
0.9.10
Security: Fixed multiple security-related issues identified in an audit.
0.9.9
Improvement: Styled hover tooltips added to Traffic Sources and Top Pages
widgets.
Bugfix: Fixed Top Pages widget JavaScript not loading correctly on
TYPO3 v14.
0.9.8
Improvement: Shared JavaScript utilities extracted into a reusable module.
Improvement: Empty site groups are now hidden in the backend module.
0.9.7
Improvement: Non-manager backend users now open the Analytics dashboard
with a read-only watcher role.
Improvement: Sites in the backend module are grouped by active status.
Improvement: Added labels for unknown device types in Traffic Sources.
Improvement: No-data states in widgets are rendered as styled backend
alerts instead of plain text.
0.9.6
Bugfix: Fixed Traffic Sources widget not displaying the no-data state
correctly.
0.9.5
Feature: The module logo, module icon, and CSP frame-src are now
configurable via partner/API configuration.
Improvement: The Page Performance Bar now loads asynchronously — a
skeleton is shown immediately while data is fetched in the background.
Bugfix: Fixed country and browser session totals; "Others" aggregation
now works correctly in Traffic Sources.
0.9.0
Initial release with backend module, dashboard widgets (Traffic Graph, Site
Performance, Top Pages, Traffic Sources), and Page Performance Bar.
Development demo data mode for exploring widgets without a live account.