SAV Charts 

Extension key

sav_charts

Version

14.5

Language

en

Description

Extension which displays charts using the Charts.js library

Keywords

sav_charts

Copyright

2026

Author

Laurent Foulloy

Email

yolf.typo3@orange.fr

License

This document is published under the Open Content License available from www.opencontent.org/openpub.

Rendered

Sat, 05 Sep 2026 19:21:48 +0000

The content of this document is related to TYPO3, a GNU/GPL CMS/Framework available from www.typo3.org.

Table of Contents 

Introduction 

What Does it Do? 

This extension displays charts using the Chart.js library.

SAV Charts was originally designed to build chart configurations through XML tags instead of JavaScript. Markers can be introduced in templates. Data can also be changed through XML either manually or using query managers.

The following charts type are available :

  • Bar charts
  • Bubble charts
  • Doughnut charts
  • Line charts
  • Pie charts
  • Polar area charts
  • Radar charts
  • Stacked bar charts
  • Horizontal bar charts
  • Scatter Line Charts
  • Charts can also be combined (Combo charts), e.g. a bar chart with a line chart

Screenshots 

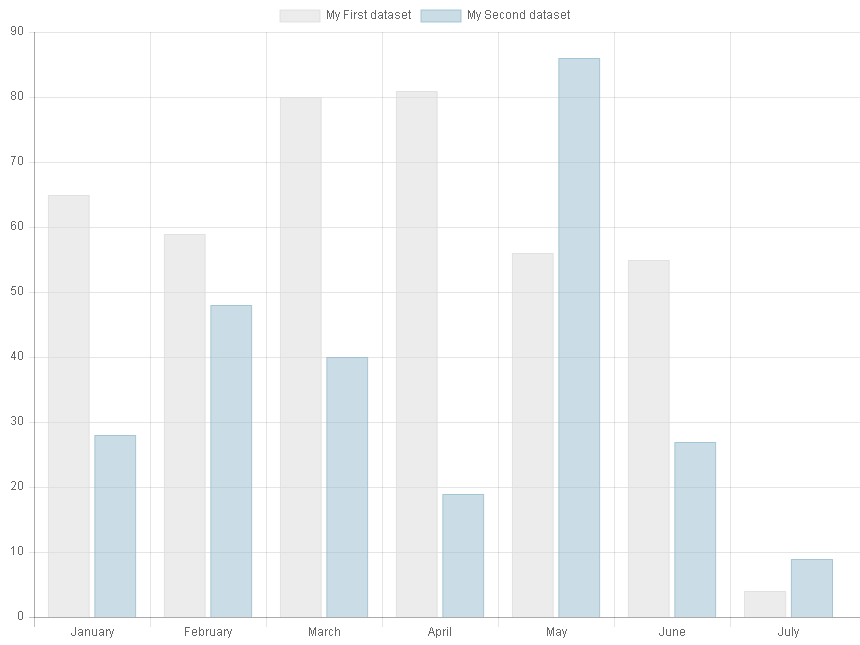
Bar Chart 

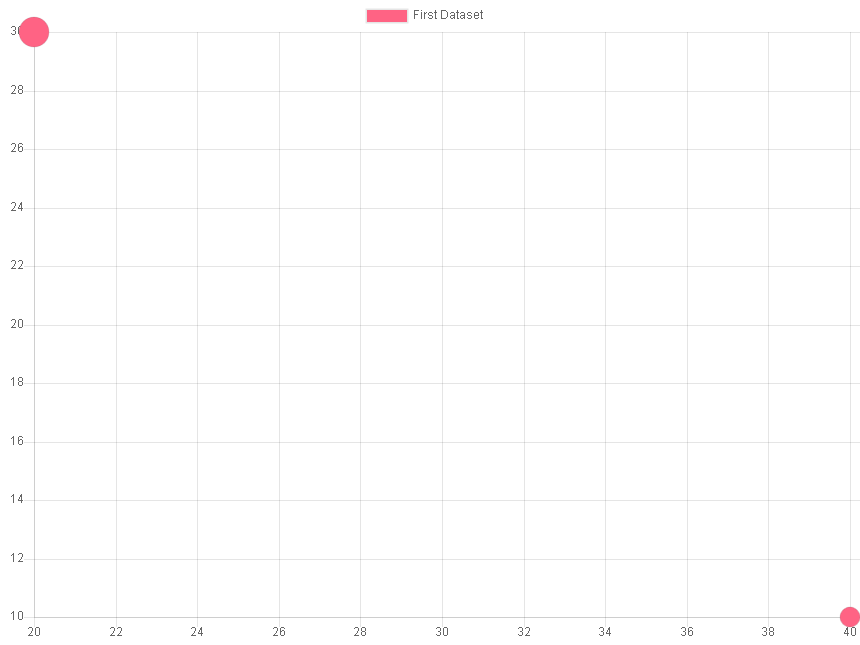
Bubble Chart 

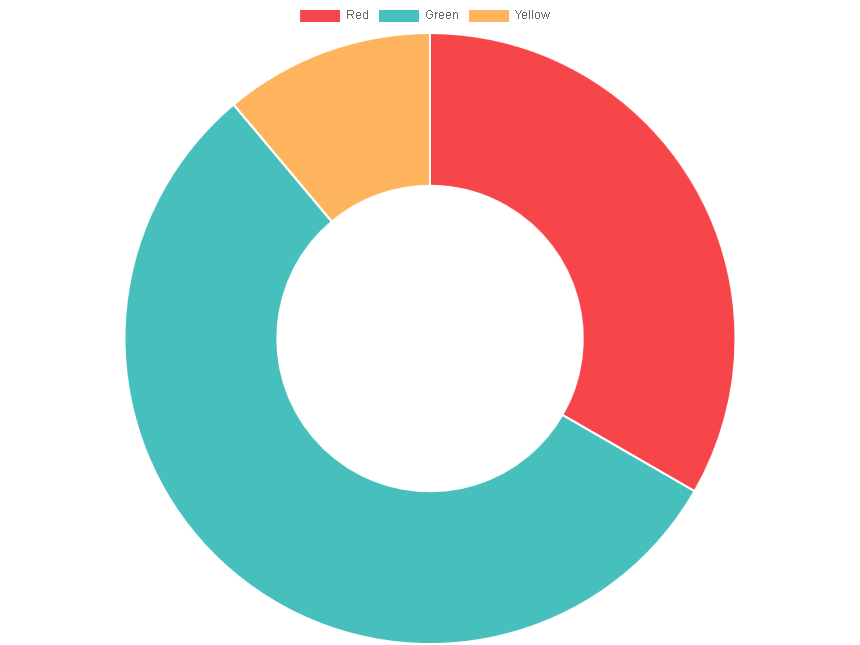
Doughnut Chart 

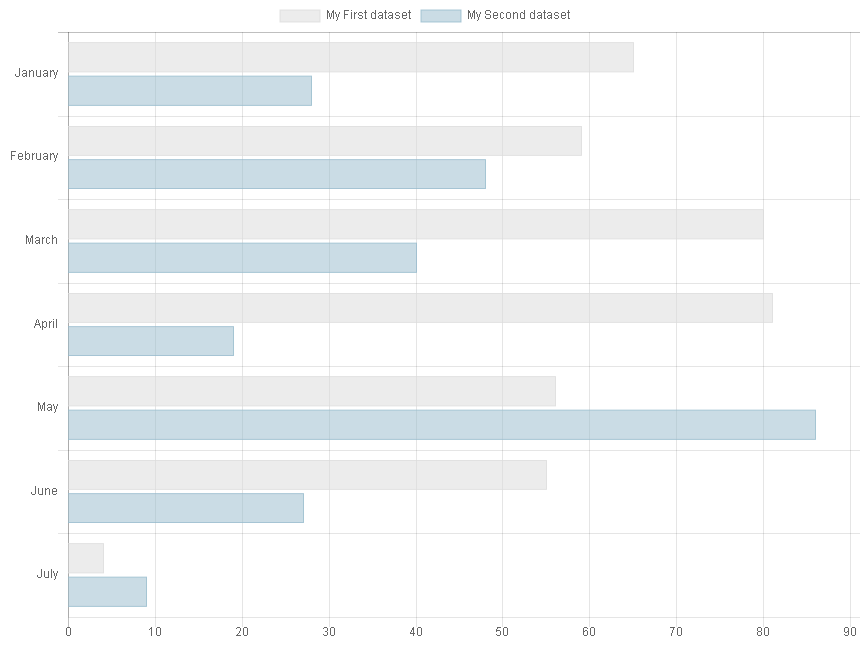
Horizontal Bar Chart 

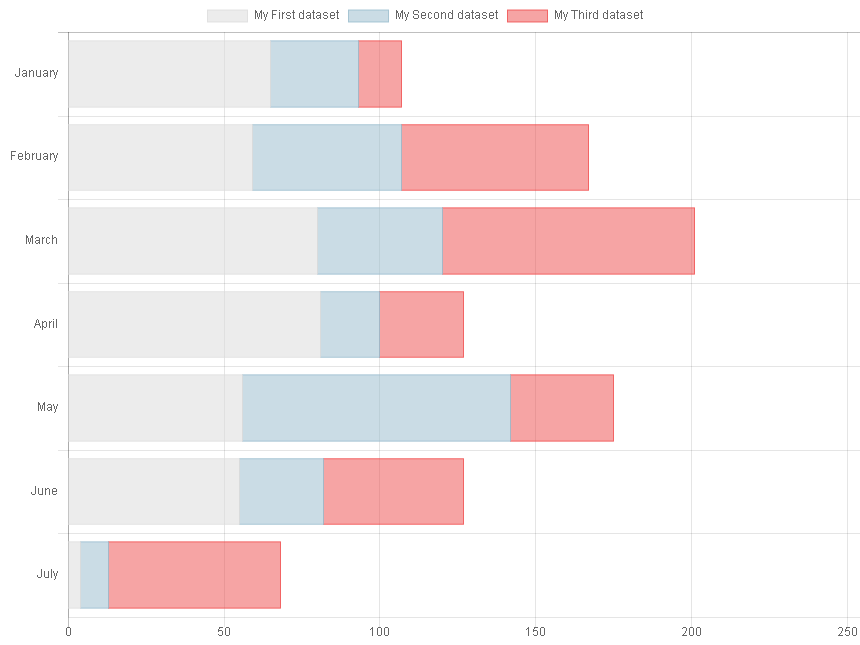
Horizontal Stacked Bar Chart 

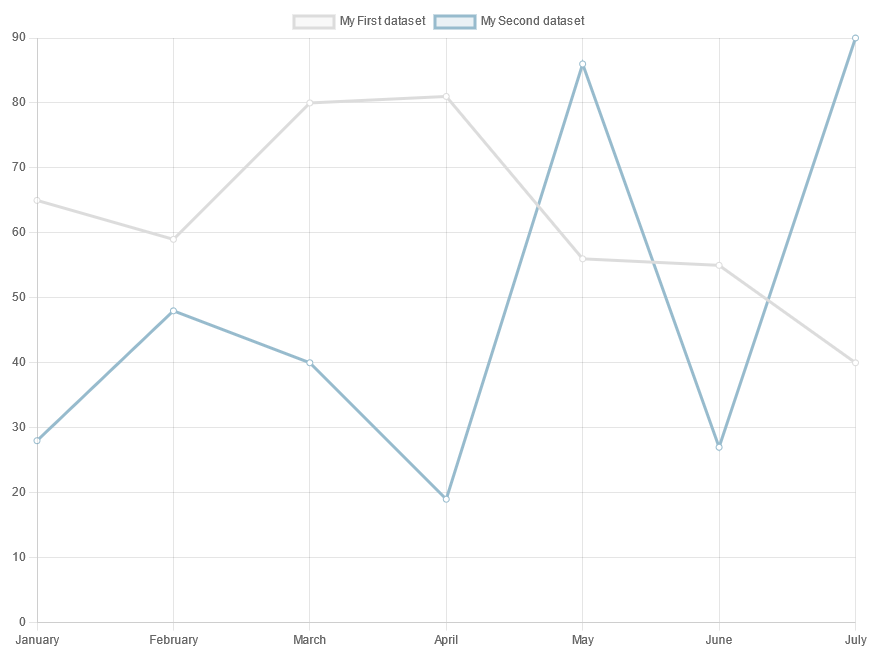
Line Chart 

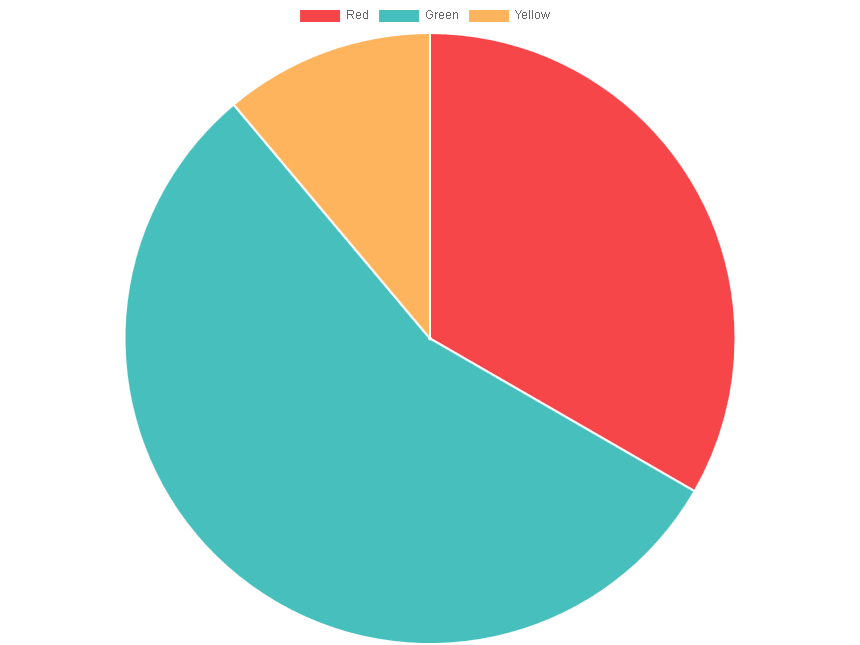
Pie Chart 

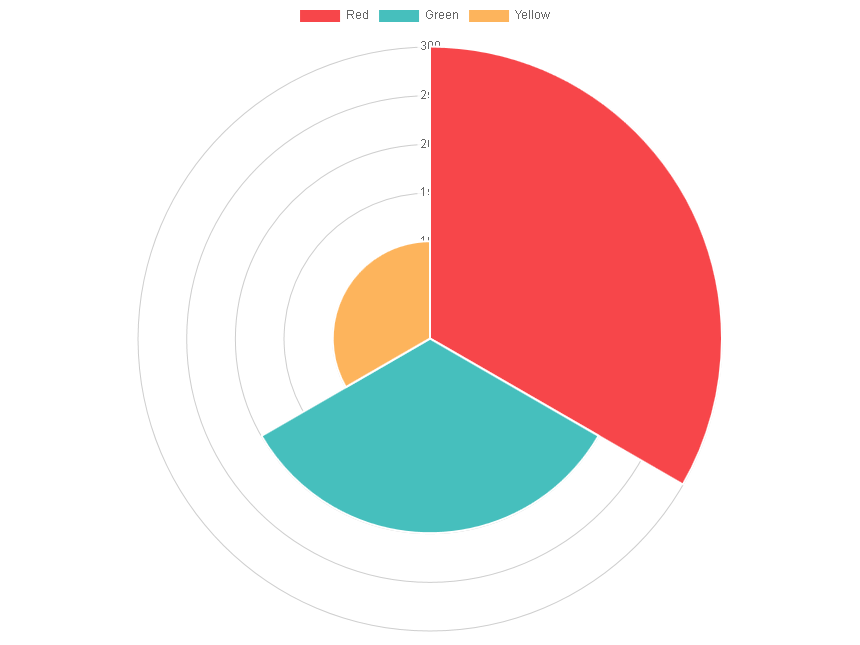
Polar Area Chart 

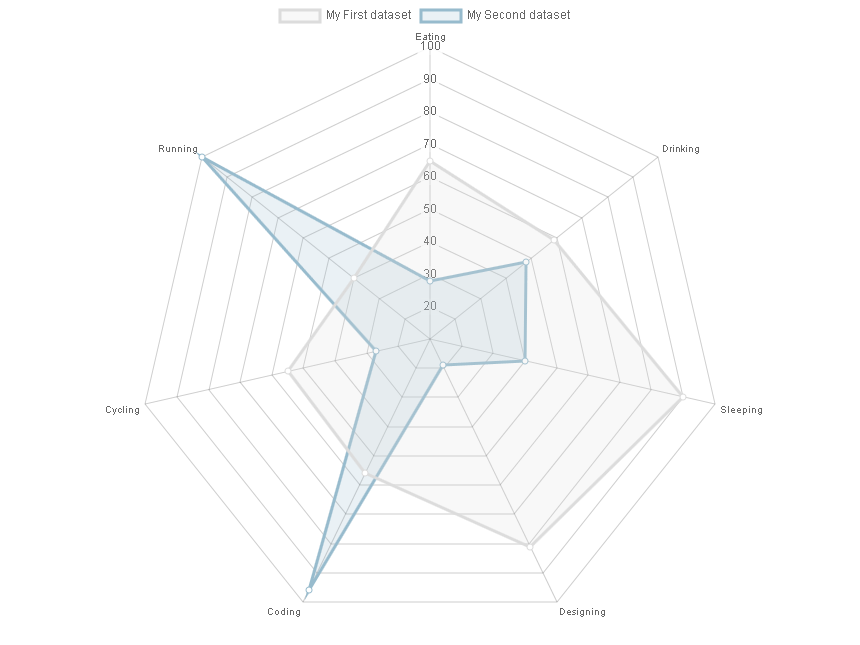
Radar Chart 

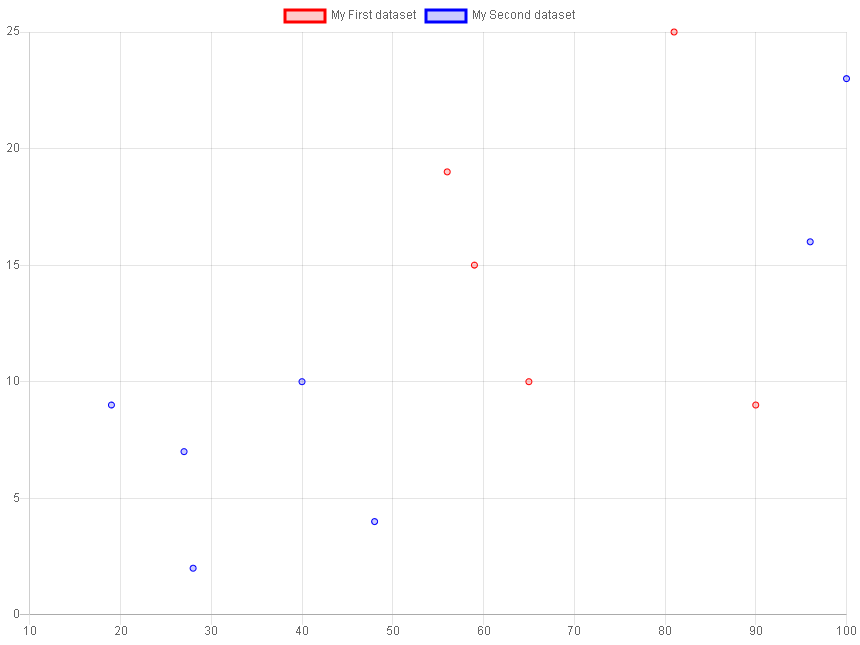
Scatter Chart 

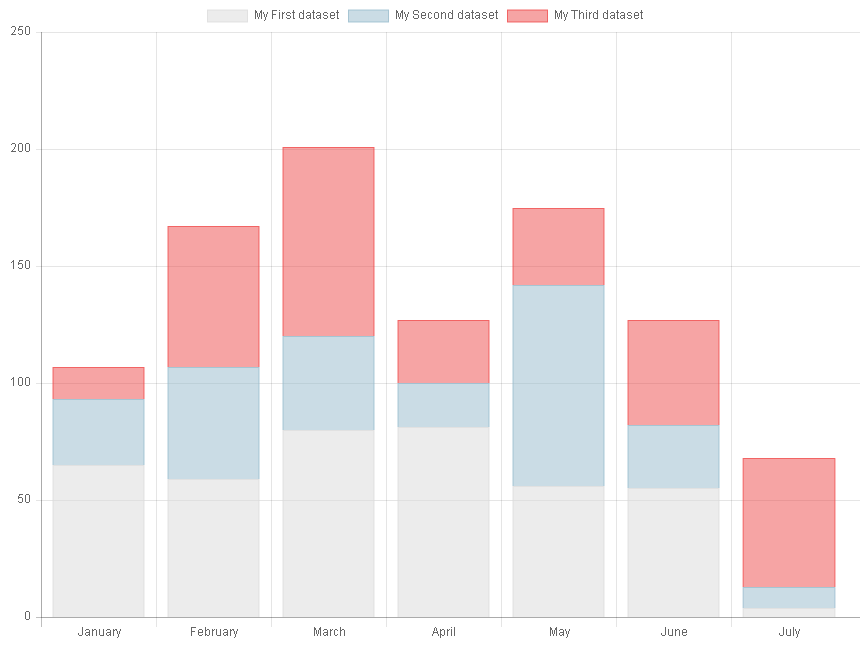
Stacked Bar Chart 

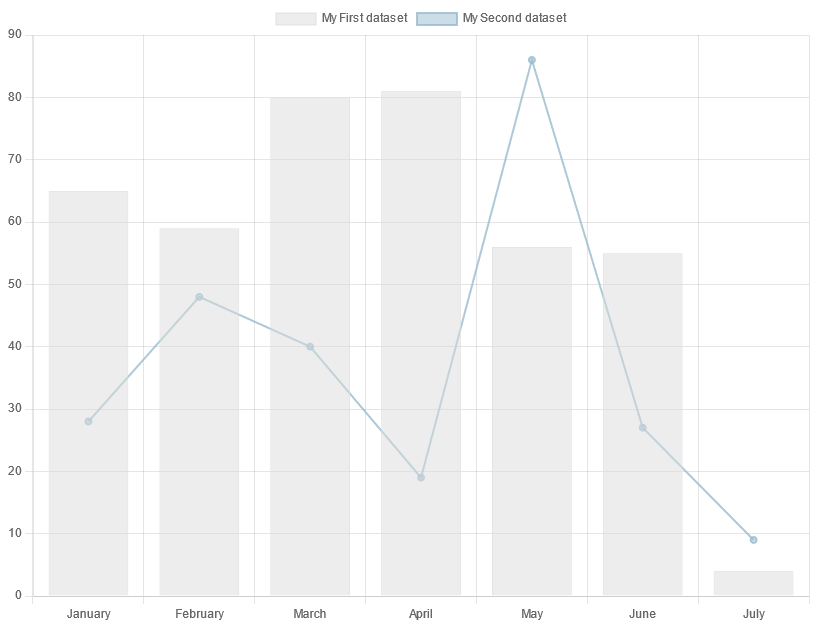
Combination Chart 

Users Manual 

  1. Download and install the extension in your site's dependencies. The extension comes with default site settings.
  2. Read the tutorial section.

Administration 

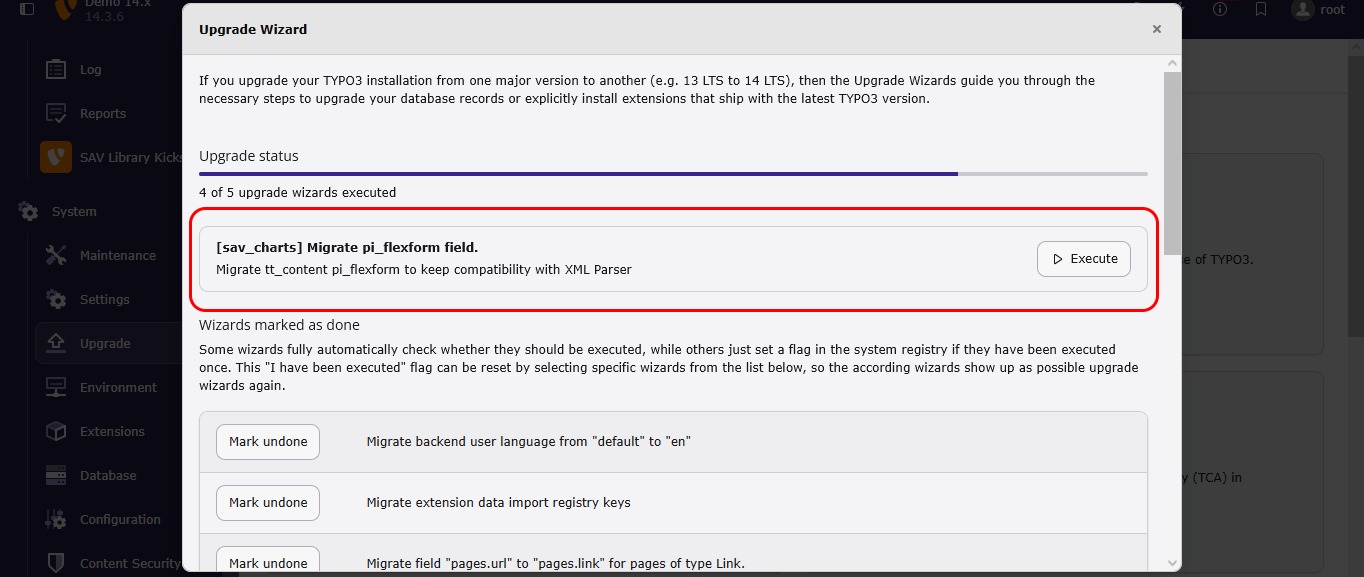
The SAV Charts is provided with an upgrade wizard that converts the existing Flexforms on your website. The upgrade wizard adds three sheets to the Flexforms (see Plugin Interface). It also duplicates existing XML parser configurations as closely as possible to Fluid parser configurations.

Reference 

Starting with version 14.5.0, SAV Charts is provided with two template parsers.

XML Parser Reference 

XML parser is the historic parser developed for TYPO3 6.2. and later.

The general syntax for references is tag#id.

Fluid Parser Reference 

Fluid parser is the new parser based on Fluid syntax.

The general syntax for references is tag__id. The value associated with the reference is obtained by the Fluid accessor {tag__id}.

XML Parser Reference 

All tag attributes can take a value or be a reference to a specific tag. The allowed syntaxes are:

  • tag#id. The attribute value will be replaced by the tag whose ID is id (tags can be any allowed tag as marker, data, barChart...). See for example the provided template barCharts.xml in which there is the following line. The attribute value is replaced by the marker whose ID is labelSet1.

    <item key="label" value="marker#labelSet1" />
    Copied!
  • tag#id:integer1. The tag whose ID is id must be an array. The attribute value will be replaced by the item at the position given by integer1.
  • tag#id:integer1-integer2. The tag whose ID is id must be an array. The attribute value will be replaced by the sub-array starting at integer1 and ending at integer2.
  • for#id:value. The tag is replaced by the curent value of the attribute each in the <for> tag.
  • for#id:key. The tag is replaced by the curent key of the attribute each in the <for> tag.
  • tag#id:for#idFor:key. The tag whose ID is id must be an array. The attribute value will be replaced by the item at the position given by key of the current each attribute of the <for> tag whose ID is IdFor.
  • tag#id:for#idFor:value. The tag whose ID is id must be an array. The attribute value will be replaced by the item at the position given by value of the current each attribute of the <for> tag whose ID is IdFor.

Table of Contents 

Chart Tags 

charts

charts
<charts>...</charts>
Copied!
Type

Root object

Description

Creates a charts object. The tag <charts> is the root xml element.

addItem

addItem
<addItem reference="object#id" key="myKey" value="myValue" />
    
Copied!
Type

Root method

Description

Method associated with the root tag <charts> which adds an item in an array.

Attributes
  • reference (required): the object reference.
  • key (required): the key of the item in the array.
  • value(required): the value associated with the item.

exportCsv

exportCsv
<exportCvs reference="object#id" data="object#id" />
Copied!
Type

Root method

Description

Method associated with the root tag <charts> which makes it possible to export data in the CSV format.

Attributes
  • reference (required): the object reference.
  • data (required): the reference to data.
  • rowHeader: if set, the reference to the row header.
  • columnHeader: if set, the reference to the column header.
  • encoding: if set, the encoding is used to convert the output. By default, the CSV output is converted to ISO-8859-1.

setId

setId
<setId reference="object#id" newId="myNewId" />
Copied!
Type

Root method

Description

Method associated with the root tag <charts> which makes it possible to change the id of the object given in the reference attribute.

Attributes
  • reference (required): the object reference.
  • newId (required): the new id.

barChart

barChart
<barChart id="myBarChartId" data="data#myBarChartData">...</barChart>
Copied!
Type

Object

Description

Creates a bar chart object.

Attributes
  • id (required): the identifier.
  • data (required): a reference to the data used for the chart (in general a reference to a data object).
  • options: a reference to the options (in general a reference to a data object).
  • width: the canvas width. If this attribute is not provided, the default width is 400.
  • height: the canvas height. If this attribute is not provided, the default height is 300.

bubbleChart

bubbleChart
<bubbleChart id="myBubbleChartId" data="data#myBubbleChartData">...</bubbleChart>
Copied!
Type

Object

Description

Creates a buble chart object.

Attributes
  • id (required): the identifier.
  • data (required): a reference to the data used for the chart (in general a reference to a data object).
  • options: a reference to the options (in general a reference to a data object).
  • width: the canvas width. If this attribute is not provided, the default width is 400.
  • height: the canvas height. If this attribute is not provided, the default height is 300.

doughnutChart

doughnutChart
<doughnutChart id="myDoughnutChartId" data="data#myDoughnutChartData">...</doughnutChart>
Copied!
Type

Object

Description

Creates a doughnut chart object.

Attributes
  • id (required): the identifier.
  • data (required): a reference to the data used for the chart (in general a reference to a data object).
  • options: a reference to the options (in general a reference to a data object).
  • width: the canvas width. If this attribute is not provided, the default width is 400.
  • height: the canvas height. If this attribute is not provided, the default height is 300.

horizontalBarChart

horizontalBarChart
<horizontalBarChart id="myhorizontalBarChartId" data="data#myhorizontalBarChartData">...</horizontalBarChart>
Copied!
Type

Object

Description

Creates an horizontal bar chart object.

Attributes
  • id (required): the identifier.
  • data (required): a reference to the data used for the chart (in general a reference to a data object).
  • options: a reference to the options (in general a reference to a data object).
  • width: the canvas width. If this attribute is not provided, the default width is 400.
  • height: the canvas height. If this attribute is not provided, the default height is 300.

horizontalStackedBarChart

horizontalStackedBarChart
<horizontalStackedBarChart id="myhorizontalStackedBarChartId" data="data#myhorizontalStackedBarChartData">...</horizontalStackedBarChart>
Copied!
Type

Object

Description

Creates an horizontal stacked bar chart object.

Attributes
  • id (required): the identifier.
  • data (required): a reference to the data used for the chart (in general a reference to a data object).
  • options: a reference to the options (in general a reference to a data object).
  • width: the canvas width. If this attribute is not provided, the default width is 400.
  • height: the canvas height. If this attribute is not provided, the default height is 300.

lineChart

lineChart
<lineChart id="myLineChartId" data="data#myLineChartData">...</lineChart>
Copied!
Type

Object

Description

Creates a doughnut chart object.

Attributes
  • id (required): the identifier.
  • data (required): a reference to the data used for the chart (in general a reference to a data object).
  • options: a reference to the options (in general a reference to a data object).
  • width: the canvas width. If this attribute is not provided, the default width is 400.
  • height: the canvas height. If this attribute is not provided, the default height is 300.

pieChart

pieChart
<pieChart id="myPieChartId" data="data#myPieChartData">...</pieChart>
Copied!
Type

Object

Description

Creates a pie chart object.

Attributes
  • id (required): the identifier.
  • data (required): a reference to the data used for the chart (in general a reference to a data object).
  • options: a reference to the options (in general a reference to a data object).
  • width: the canvas width. If this attribute is not provided, the default width is 400.
  • height: the canvas height. If this attribute is not provided, the default height is 300.

polarAreaChart

polarAreaChart
<polarAreaChart id="myPolarAreaChartId" data="data#myPolarAreaChartData">...</polarAreaChart>
Copied!
Type

Object

Description

Creates a polar Area chart object.

Attributes
  • id (required): the identifier.
  • data (required): a reference to the data used for the chart (in general a reference to a data object).
  • options: a reference to the options (in general a reference to a data object).
  • width: the canvas width. If this attribute is not provided, the default width is 400.
  • height: the canvas height. If this attribute is not provided, the default height is 300.

radarChart

radarChart
<radarChart id="myRadarChartId" data="data#myRadarChartData">...</radarChart>
Copied!
Type

Object

Description

Creates a radar chart object.

Attributes
  • id (required): the identifier.
  • data (required): a reference to the data used for the chart (in general a reference to a data object).
  • options: a reference to the options (in general a reference to a data object).
  • width: the canvas width. If this attribute is not provided, the default width is 400.
  • height: the canvas height. If this attribute is not provided, the default height is 300.

scatterChart

scatterChart
<scatterChart id="myScatterChartId" data="data#myScatterChartData">...</radarChart>
Copied!
Type

Object

Description

Creates a scatter chart object.

Attributes
  • id (required): the identifier.
  • data (required): a reference to the data used for the chart (in general a reference to a data object).
  • options: a reference to the options (in general a reference to a data object).
  • width: the canvas width. If this attribute is not provided, the default width is 400.
  • height: the canvas height. If this attribute is not provided, the default height is 300.

stackedBarChart

stackedBarChart
<stackedBarChart id="myStackedBarChartId" data="data#myStackedBarChartData">...</stackedBarChart>
Copied!
Type

Object

Description

Creates a stacked bar chart object.

Attributes
  • id (required): the identifier.
  • data (required): a reference to the data used for the chart (in general a reference to a data object).
  • options: a reference to the options (in general a reference to a data object).
  • width: the canvas width. If this attribute is not provided, the default width is 400.
  • height: the canvas height. If this attribute is not provided, the default height is 300.

Data Tags 

data

data
<data id="myDataId">5,6,7</data>
Copied!
Type

Object

Description

Creates a data object from a comma separated list of data.

Attributes
  • id (required): the identifier.

It is equivalent to:

<data id="myDataId">
    <setData values="5,6,7"/>
</template>
Copied!

setData

setData
<setData values="5,6,7" />
Copied!
Type

Default method

Description

Sets the values from a comma separated list of data.

Attributes
  • values (required): comma separated list of data.

callback

callback
<callback key="callbackKey">callbackFileName.js</callback>
<callback key="callbackKey"><!-- JavaScript function --></callback>
Copied!
Type

Method

Description

Defines a callback. The javacript function can be provided by means of a file name or inserted inserted inline inside an XML comment (see the FAQ section for an example).

Attributes
  • key (required): the key for the callback.

changeToPercentage

changeToPercentage
<changeToPercentage />
Copied!
Type

Method

Description

Changes the data to percentage.

Attributes
  • precision: the precision for rounding floats (default value is 1).

item

item
<item key="myKey" value="tag#id" /> or
<item key="myKey" value="5" /> or
<item key="myKey" values="1, 3, 5" /> or
<item key="myKey">5</item>
Copied!
Type

Method

Description

Sets a data item either by means of a reference, a value or a comma-separated list of values.

Attributes
  • key (required): the key for the item.
  • value: if set, the value is defined directly or by the reference, for example data#myDataId. If value is equal to true or false then a boolean value is generated for this item.
  • type: if this attribute is equal to function, the value attribute is taken as the name of a JavaScript function.
  • values: if set, a comma-sparated list of values is assumed.
  • if no value or values attribute is provided, the tag childs can be a value or other <item> tags.

setDataFromQuery

setDataFromQuery
<setDataFromQuery query="myQueryId" field="fieldName" />
Copied!
Type

Method

Description

Defines the data from a query.

Attributes
  • query (required): the query identifier.
  • field (required): the field to extract from the query result.
  • groupby: it set, either the size of the reference defined by the tag and the id, for example "data#myDataId", or the given integer, will be used to group the data. It means that an new array element will be generated each time the count is reached. This option is useful to display data when GROUP BY clause is used in the query.

setDataFromQueryRow

setDataFromQueryRow
<setDataFromQueryRow query="myQueryId" fields="fieldName1, fieldName2, fieldName3" />
Copied!
Type

Method

Description

Defines the data from the row of a query.

Attributes
  • query (required): the query identifier.
  • fields (required): the comma-separated list of fields to extract from the query row.

For Tags 

for

for
<for each="data#myData">...</for>
Copied!
Type

Object

Description

Repeats the sequence inside the tag for each element provided by means of the each attribute.

Attributes
  • each (required): the element for the repetition.

Marker Tags 

marker

marker
<marker id="myMarkerId">marker value</marker>
Copied!
Type

Object

Description

Creates a marker object

Attributes
  • id (required): the identifier.

It is equivalent to:

<marker id="myMarkerId">
    <setMarker value="marker value"/>
</template>
Copied!

setMarker

setMarker
<setMarker value="marker value" />
Copied!
Type

Default method

Description

Defines the marker.

Attributes
  • value (required): the value for the marker.

setMarkerByPieces

setMarkerByPieces
<setMarkerByPieces attribute1 .. AttributeN />
Copied!
Type

Default method

Description

Defines the markerby concatenating the attributes.

Attributes
  • Any attribute name can be used. The resulting marker is the concatenation of all attribute values.

In the following exemple, the marker myMarkerId has the value Number of pages created per year.

<marker id="myMarkerId">
   <setMarkerByPieces part1="Number of " part2="pages created " part3="per year" />
</marker>
Copied!

This method is useful when markers include information from a query, for example. In this case, a part is a reference to the data generated by the query.

Plugin Tags 

plugin

plugin
<plugin chartId="myChart#id" key="pluginKey" fileName="pluginFileName" /">
Copied!
Type

Object

Description

Loads the JavaScript file (see the FAQ section).

Attributes

chartId (required): the chart identifier.

- fileName (required): The file name of the JavaScript function.

Query Tags 

query

query
<query id="myQueryId">...</query>
Copied!
Type

Object

Description

Creates a query object.

Attributes

required): the identifier.

setQueryManager

setQueryManager
<setQueryManager name="savcharts" uid="queryUid" marker1="myMarker" ... />
Copied!
Type

Object

Description

Defines the query manager associated with the query.

Attributes
  • name (required): Unless you have define you own query manager, use savcharts.
  • uid (required): The uid of your query. Queries are defined in the backend.
  • other attributes define markers that can be used in the query clauses. In these clauses ###myMarker### will be replaced by the value of the marker myMarker. Any attribute name, except name and uid can be used.

    Markers can be directly defined as, for example, myMarker#myValue. In that case, the marker name will be myMarker and its value is myValue.

    Markers can be defined as a reference to a marker tag, for example marker#myMarker. In that case, the marker name will be myMarker and its value is the value of the marker whose id is myMarker.

    Markers can also be defined as a reference to a specific element in a data or marker array, for example myMarker#data#myData:0. In that case, the marker name will be myMarker and its value is obtained from the data with index 0 and whose id is myData.

Template Tags 

template

template
<template id="myTemplateId">yourFileName.xml</template>
Copied!
Type

Object

Description

Loads the XML template file given inside the XML tag. The file name is relative to the site path.

Attributes
  • id (required): the identifier.

It is equivalent to:

<template id="myTemplateId">
   <loadTemplate fileName="yourFileName.xml"/>
</template>

 
Copied!

loadTemplate

loadTemplate
<loadTemplate fileName="yourFileName.xml"/>
Copied!
Type

Default method

Description

Loads the XML template file given in the fileName attribute.

Attributes
  • fileName (required): the file name is relative to the site path.

Available Chart ViewHelpers 

The following ViewHelpers may be used to build charts:

  • <c:barChart>
  • <c:bubbleChart>
  • <c:doughnutChart>
  • <c:horizontalBarChart>
  • <c:horizontalStackedBarChart>
  • <c:lineChart>
  • <c:pieChart>
  • <c:polarAreaChart>
  • <c:radarChart>
  • <c:scatterBarChart>
  • <c:stackedBarChart>

All of them have the same arguments.

Example 

<c:barChart id="1" data="data__barChartData" options="data__barChartOptions" width="600" height="400">
    ...
</c:barChart>
Copied!

Arguments 

id

id
Required

true

Type
string

Chart ID

data

data
Required

true

Type
mixed

Data, or a reference to data

options

options
Required

true

Type
mixed

Options, or a reference to options

width

width
Type
string
Default
600

Width value, or a reference to the width value

height

height
Type
string
Default
400

Height value, or a reference to the height value

Callback ViewHelper <c:callback> 

ViewHelper that includes a JavaScript function.

Go to the source code of this ViewHelper: CallbackViewHelper.php (GitHub).

Arguments 

The following arguments are available for the callback ViewHelper:

key

key
Required

true

Type
string

Callback key

fileName

fileName
Default
''
Type
string

File name containing the JavaScript function

Examples 

With fileName attribute 

The JavaScript function must be in the given file name.

<c:item key="tooltip">
    <c:item key="callbacks">
        <c:callback key="label" fileName="EXT:sav_charts/Resources/Public/Callbacks/TooltipLabel.js" />
    </c:item>
</c:item>
Copied!

Child nodes 

The JavaScript function is provided in the child node.

<c:item key="tooltip">
    <c:item key="callbacks">
        <c:callback key="label">
            function(context) {
                return context.label + ' - ' + context.formattedValue + ' €';
            }
        </c:callback>        
    </c:item>            
</c:item>
Copied!

Charts ViewHelper <c:charts> 

Root ViewHelper to include charts.

Go to the source code of this ViewHelper: ChartsViewHelper.php (GitHub).

Arguments 

The charts ViewHelper has no argument.

Examples 

Defining a Bar Chart 

<c:charts>
    <c:barChart id="1" data="data__barChartData" options="data__barChartOptions" >
        ...
    </c:barChart>
</c:charts>
Copied!

Data ViewHelper <c:data> 

ViewHelper which defines data.

Go to the source code of this ViewHelper: DataViewHelper.php (GitHub).

Arguments 

The following arguments are available for the data ViewHelper:

id

id
Required

true

Type
string

Data ID

values

values
Type
mixed

Examples 

With values attribute 

<c:data id="size" values="12" />
<c:data id="columnHeader" values="{data__labels}" />
    
    
Copied!

Child nodes 

<c:data id="dataSets">
    <c:item key="0" value="{data__set0}" />
    <c:item key="1" value="{data__set1}" />
</c:data>
Copied!
<c:data id="labels">
    January, February, March, April, May, June, July
</c:data>
Copied!

ExportCsv ViewHelper <c:exportCsv> 

ViewHelper that exports data in CSV format.

Go to the source code of this ViewHelper: ExportCsvViewHelper.php (GitHub).

Arguments 

The following arguments are available for the exportCsv ViewHelper:

data

data
Required

true

Type
mixed

Data to export

fileName

fileName
Required

true

Type
string

File name to save the CSV in typo3temp/sav_charts

columnHeader

columnHeader
Type
array

Column header

rowHeader

rowHeader
Type
array

Row header

Examples 

Exporting data with a column header 

<c:data id="data">
      <c:item key="0" values="65, 59, 80, 81, 56, 55, 40" />
      <c:item key="1"values="1.5, 3, 5, 10, 17, 20, 24" />  
</c:data>

<c:template id="1">
    EXT:sav_charts/Resources/Private/Templates/ChartsExamples/FluidParser/HorizontalBarChartAdvanced.fluid
</c:template>

         
<c:exportCSV fileName="Export_1.csv" columnHeader="{data__labels}" data="{data__data}" /> 
Copied!

Exporting data with a column header and a row header 

<c:marker id="labelSet0">Humidity</c:marker>
<c:marker id="labelSet1">Temperature</c:marker>

<c:exportCSV fileName="Export_2.csv" rowHeader="{0:'', 1:marker__labelSet0, 2:marker__labelSet1}" columnHeader="{data__labels}" data="{data__data}" /> 
Copied!

Exporting transposed data with a column header 

<c:exportCSV fileName="Export_3.csv" columnHeader="{0:marker__labelSet0, 1:marker__labelSet1}" data="{data__data->c:transpose()}" />
Copied!

Item ViewHelper <c:item> 

ViewHelper which defines items.

Go to the source code of this ViewHelper: ItemViewHelper.php (GitHub).

Arguments 

The following arguments are available for the item ViewHelper:

key

key
Required

true

Type
string

Item key

value

value
Type
mixed

Item value

values

values
Type
string

Item comma-separated values

Examples 

With values attribute 

<c:data id="data">
    <item key="0" values="1, 6, 8, 3" />
    <item key="1" values="2, 4,10, 5" />
</c:data>
    
Copied!

With value attribute 

<c:data id="data">
    <c:item key="0" value="{data__set0}" />
    <c:item key="1" value="{data__set1}" />
</c:data>
    
Copied!

Child nodes 

<c:data id="lowIntensityColors">
    <c:item key="0">rgba(77, 77, 77, 0.2)</c:item>
    <c:item key="1">rgba(93, 165, 218, 0.2)</c:item>
    <c:item key="2">rgba(250, 164, 58, 0.2)</c:item>
</c:data>
Copied!
<c:data id="lineChartOptions">
    <c:item key="scales"> 
        <c:item key="y">
            <c:item key="max" value="100" /> 
            <c:item key="min" value="10" />
            <c:item key="ticks">      
                <c:item key="stepSize" value="5" />
            </c:item>
        </c:item>
         <c:item key="x">
            <c:item key="ticks">
                 <c:item key="font">
                       <c:item key="size" value="15" />
                       <c:item key="style" value="italic" />
                 </c:item>
                 <c:item key="color" value="rgb(200, 0, 0)" />
                 <c:callback key="callback">
                    function(value, index, values) {
                        return '- ' + this.getLabelForValue(value) + ' -';
                    }
                 </c:callback>
              </c:item>
        </c:item>
    </c:item>
</c:data>
Copied!

Marker ViewHelper <c:marker> 

ViewHelper that defines markers.

Go to the source code of this ViewHelper: MarkerViewHelper.php (GitHub).

Arguments 

The following arguments are available for the marker ViewHelper:

id

id
Required

true

Type
string

Marker ID

value

value
Type
string

Marker value

reload

reload
Default
false
Type
boolean

If true, the marker is reloaded if it exists

Examples 

With value attribute 

<c:marker id="width" value="600" />
Copied!

Child nodes -----------

<c:marker id="width">600</c:marker>
Copied!

Template ViewHelper <c:plugin> 

ViewHelper that includes a plugin.

Go to the source code of this ViewHelper: PluginViewHelper.php (GitHub).

Arguments 

The following arguments are available for the plugin ViewHelper:

chartId

chartId
Required

true

Type
string

key

key
Required

true

Type
string

Plugin key

fileName

fileName
Default
''
Type
string

File name containing the JavaScript function

Examples 

The following examples should be included in the "Templates" field of the "Fluid Parser" tab of the plugin.

With fileName attribute 

<c:plugin chartId="pieChart__1" key="chartAreaBorder" fileName="EXT:sav_charts/Resources/Public/Plugins/ChartAreaBorder.js" />
Copied!

Child nodes 

The JavaScript function is directly inserted in the child.

<c:plugin chartId="pieChart__1" key="chartAreaBorder">
    beforeDraw(chart, args, options) {
        const { 
            ctx, 
            chartArea: { left, top, width, height } 
        } = chart;
    
        ctx.save();
        ctx.strokeStyle = options.borderColor;
        ctx.lineWidth = options.borderWidth;
        ctx.setLineDash(options.borderDash || []);
        ctx.lineDashOffset = options.borderDashOffset;
        ctx.strokeRect(left, top, width, height);
        ctx.restore();
    }
</c:plugin>
Copied!

Query ViewHelper <c:query> 

ViewHelper which defines queries.

Go to the source code of this ViewHelper: QueryViewHelper.php (GitHub).

Arguments 

The following arguments are available for the query ViewHelper:

id

id
Required

true

Type
string

Query ID

manager

manager
Type
string

Query manager

uid

uid
Type
string

UID of the query record

Example 

<c:query id="1"  manager="savcharts" uid="1" />    

<c:data id="labels" values="{query__1.Year}" />
<c:data id="data">
      <c:item key="0" value="{query__1.Count}" />
</c:data>
Copied!

Template ViewHelper <c:template> 

ViewHelper that includes a SAV Charts template.

Go to the source code of this ViewHelper: TemplateViewHelper.php (GitHub).

Arguments 

The following arguments are available for the template ViewHelper:

id

id
Required

true

Type
string

Template id.

fileName

fileName
Default
''
Type
string

File name containing the template

Examples 

The following examples should be included in the "Templates" field of the "Fluid Parser" tab of the plugin.

With fileName attribute 

<c:template id="1" fileName="EXT:sav_charts/Resources/Private/Templates/ChartsExamples/FluidParser/BarChart.fluid" />
Copied!

Child nodes 

<c:template id="1">
    EXT:sav_charts/Resources/Private/Templates/ChartsExamples/FluidParser/BarChart.fluid
</c:template>
Copied!

Transpose ViewHelper <c:transpose> 

ViewHelper that transposes data.

Go to the source code of this ViewHelper: TransposeViewHelper.php (GitHub).

Arguments 

The following arguments are available for the transpose ViewHelper:

data

data
Required

true

Type
array

Data to transpose

Examples 

With data attribute 

<c:data id="data">
    <c:item key="0" values="65, 59, 80, 81, 56, 55, 40" />
    <c:item key="1"values="1.5, 3, 5, 10, 17, 20, 24" />  
</c:data>

<f:variable name="tranposedData"><c:transpose data="{data__data}" /></f:variable>
Copied!

Inline 

<c:data id="data">
    <c:item key="0" values="65, 59, 80, 81, 56, 55, 40" />
    <c:item key="1"values="1.5, 3, 5, 10, 17, 20, 24" />  
</c:data>

<f:variable name="tranposedData" value="{data__data->c:transpose()}" />
Copied!

Tutorials 

Starting with version 14.5.0, SAV Charts comes with two template parsers and a new plugin interface in the backend.

Plugin Interface 

The plugin contains a Flexform for configuring the XML and Fluid parsers. Both codes can exist simultaneously. If you already have XML code on your web server, an updater will transfer the original to the XML parser tab. An automatic conversion will also be introduced to the Fluid parser tab. A debug feature has been introduced in the Fluid parser.

Parsers 

Based mainly on the PHP class SimpleXMLElement, The XML parser provides fast chart generation.

The Fluid Parser is a new parser based solely on Fluid syntax and specific viewHelpers.

Plugin Interface 

In layout mode, the SAV Charts plugins are displayed with a modified header that provides additional information about the parser in use and the possible debug mode for the Fluid parser.

The plugin options contain three tabs. The first tab is for general configuration. This includes selecting the parser type and granting the right to use queries. The latter must be granted by an admin user.

The second tab is for XML parser configuration. It contains the same fields as the previous version of the SAV Charts extension.

The third tab is for the Fluid parser configuration. This contains the same fields as the second tab, plus a debug feature.

Parsers 

The XML parser is a parser that was developed for TYPO3 6.2 and later versions. Based mainly on the PHP class SimpleXMLElement, it provides fast chart generation. However, the PHP code is complex. XML templates lack readability when iterative processing is required.

The new Fluid parser is entirely based on Fluid syntax and viewHelpers. Since all Fluid viewHelpers can be used (e.g. <f:for>, <f:if>, and <f:variable>) the Fluid parser results in simpler templates when iterative processing is required. It also provides simpler PHP code and makes it possible to use or develop other viewHelpers.

Table of Contents 

Designing Templates From Examples 

Introduction 

The Chart.js documentation provides examples of various chart types.

The SAV Charts extension includes templates for all chart types. These templates can be found in Resources/Private/Templates/ChartExamples for the XML parser and Resources/Private/Templates/ChartExamples/FluidParser for the Fluid parser.

To display a template, simply create an SAV Charts plugin content element on a page.

Then click on the plugin tab and select the parser type.

Fill in the template field of the Flexform corresponding to the selected parser type, then save.

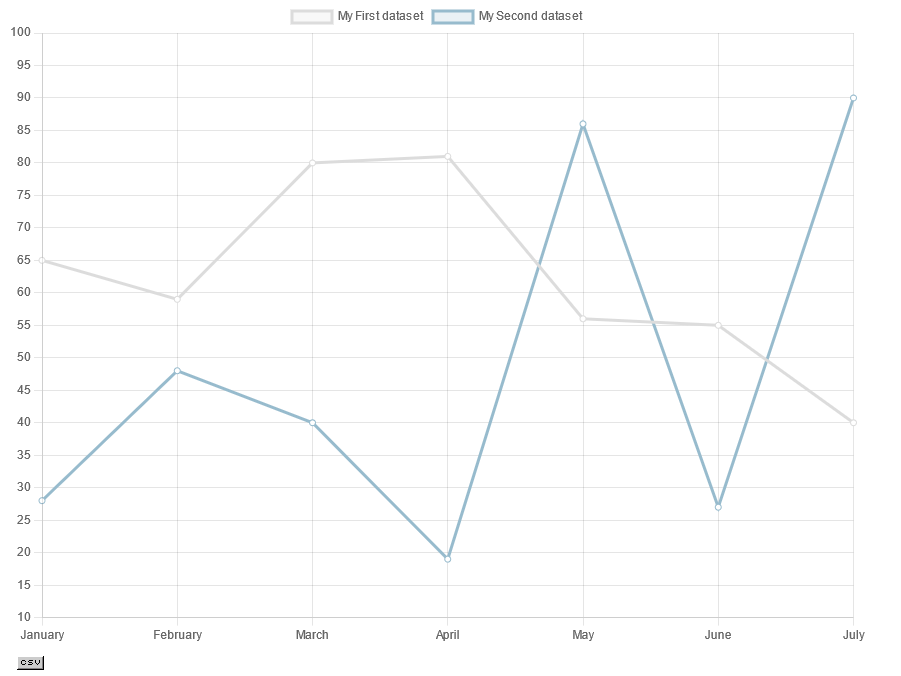
Go to the front-end and you should see the following image.

Writing Templates 

The templates provided with the extension were adapted from the examples given in the Chart.js documentation. Let us illustrate the principle for the line chart.

The JavaScript code to display the line graph is as follows:

var data = {
    labels: ["January", "February", "March", "April", "May", "June", "July"],
    datasets: [
        {
            label: "My First dataset",
            fillColor: "rgba(220,220,220,0.2)",
            strokeColor: "rgba(220,220,220,1)",
            pointColor: "rgba(220,220,220,1)",
            pointStrokeColor: "#fff",
            pointHighlightFill: "#fff",
            pointHighlightStroke: "rgba(220,220,220,1)",
            data: [65, 59, 80, 81, 56, 55, 40]
        },
        {
            label: "My Second dataset",
            fillColor: "rgba(151,187,205,0.2)",
            strokeColor: "rgba(151,187,205,1)",
            pointColor: "rgba(151,187,205,1)",
            pointStrokeColor: "#fff",
            pointHighlightFill: "#fff",
            pointHighlightStroke: "rgba(151,187,205,1)",
            data: [28, 48, 40, 19, 86, 27, 90]
        }
    ]
};
Copied!

The template is created by converting the JavaScript code into an XML structure with the data tag. Thanks to the data tag ID, references can be used and applied. These references provide an easy way to split the data, making it possible to overload them in the FlexForm data section or with queries.

The following codes are the XML or Fluid translations of the previous JavaScript code. Data tags with the IDs "labels," "dataSet1," and "dataSet2" can be easily overloaded, as explained in the next section.

<?xml version="1.0" encoding="UTF-8"?>
<charts>        
    <lineChart id="1" data="data#lineChartData" options="data#lineChartOptions" >

        <marker id="labelSet0">My First dataset</marker>
        <marker id="labelSet1">My Second dataset</marker>       

        <data id="labels">
            January, February, March, April, May, June, July
        </data>

        <data id="dataSet0">
            65, 59, 80, 81, 56, 55, 40
        </data>
    
        <data id="dataSet1">
            28, 48, 40, 19, 86, 27, 90
        </data>         

        <data id="set0">
            <item key="label" value="marker#labelSet0" />
            <item key="backgroundColor">rgba(220,220,220,0.2)</item>
            <item key="pointColor">rgba(220,220,220,1)</item>
            <item key="pointBackgroundColor">#fff</item>
            <item key="pointHoverBackgroundColor">rgba(220,220,220,1)</item>
            <item key="data" value="data#dataSet0" />
        </data> 

        <data id="set1">
            <item key="label" value="marker#labelSet12" />
            <item key="backgroundColor">rgba(151,187,205,0.2)</item>
            <item key="pointColor">rgba(151,187,205,1)</item>
            <item key="pointBackgroundColor">#fff</item>
            <item key="pointHoverBackgroundColor">rgba(151,187,205,1)</item>            
            <item key="data" value="data#dataSet1" />
        </data>     

        <data id="dataSets">
            <item key="0" value="data#set0" />
            <item key="1" value="data#set1" />
        </data>     

        <data id="lineChartData">
            <item key="labels" value="data#labels" />           
            <item key="datasets" value="data#dataSets" />       
        </data> 
    
        <data id="lineChartOptions">
        </data>     
    
    </lineChart>
</charts>
Copied!
<c:charts>        
    <c:lineChart id="1" data="data__lineChartData" options="data__lineChartOptions" >

        <c:marker id="labelSet0">My First dataset</c:marker>
        <c:marker id="labelSet1">My Second dataset</c:marker>       

        <c:data id="labels">
            January, February, March, April, May, June, July
        </c:data>

        <c:data id="dataSet0">
            65, 59, 80, 81, 56, 55, 40
        </c:data>

        <c:data id="dataSet1">
            28, 48, 40, 19, 86, 27, 90
        </c:data>         

        <c:data id="set0">
            <c:item key="label" value="{marker__labelSet0}" />
            <c:item key="backgroundColor">rgba(220,220,220,0.2)</c:item>
            <c:item key="pointColor">rgba(220,220,220,1)</c:item>
            <c:item key="pointBackgroundColor">#fff</c:item>
            <c:item key="pointHoverBackgroundColor">rgba(220,220,220,1)</c:item>
            <c:item key="data" value="{data__dataSet0}" />
        </c:data> 

        <c:data id="set1">
            <c:item key="label" value="{marker__labelSet1}" />
            <c:item key="backgroundColor">rgba(151,187,205,0.2)</c:item>
            <c:item key="pointColor">rgba(151,187,205,1)</c:item>
            <c:item key="pointBackgroundColor">#fff</c:item>
            <c:item key="pointHoverBackgroundColor">rgba(151,187,205,1)</c:item>            
            <c:item key="data" value="{data__dataSet1}" />
        </c:data>     

        <c:data id="dataSets">
            <c:item key="0" value="{data__set0}" />
            <c:item key="1" value="{data__set1}" />
        </c:data>     

        <c:data id="lineChartData">
            <c:item key="labels" value="{data__labels}" />           
            <c:item key="datasets" value="{data__dataSets}" />       
        </c:data> 
    
        <c:data id="lineChartOptions">
        </c:data>     

    </c:lineChart>
</c:charts>
Copied!

Overloading Data 

Open the plugin in the backend, fill out the Data section of the Flexform as follows, and then save.

<data id="dataSet0">
    20,22,24,20,19
</data>
<data id="dataSet1">
    55,50,51,53,60
</data>
<data id="labels">
    Monday, Tuesday, Wednesday, Thursdat, Friday            
</data>
            
Copied!
<c:data id="dataSet0">
    20,22,24,20,19
</c:data>
<c:data id="dataSet1">
    55,50,51,53,60
</c:data>
<c:data id="labels">
    Monday, Tuesday, Wednesday, Thursdat, Friday            
</c:data>
Copied!

Go in the front-end and you should see the following figure.

In SAV Charts, the principle is that the first definition is used for a given tag with a given ID. In the previous example, for instance, the dataSet0 and dataSet1 tags are defined in the data section before the template section. Consequently, they will not be replaced by the same data tags in the template. The tags in the data section overload the same tags in the template.

This provides a simple way to work with generic templates and adapt their behavior to your data. For example, with the same "LineChart.xml" template, you may want to display only one curve. This can easily be achieved by defining the "dataSets" tag in the data section, as shown below.

<data id="dataSet0">
    20,22,24,20,19
<data>
<data id="labels">
    Monday, Tuesday, Wednesday, Thursdat, Friday            
<data>
<data id="dataSets">
    <item key="0" value="data#set0" />
</data>   
Copied!
<c:data id="dataSet0">
    20,22,24,20,19
<c:data>
<c:data id="labels">
    Monday, Tuesday, Wednesday, Thursdat, Friday            
<c:data>
<c:data id="dataSets">
    <c:item key="0" value="{data__set0}" />
</c:data> 
Copied!

Enter the previous code in the FlexForm Data section. Then, save and go to the front end.

Overloading Markers 

Markers are tags that can be used to create strings. In the line chart template, two markers are used to define the labels that are displayed in the legend. You can overlay the markers in the Markers section of the Flexform. Enter the following code in the Markers and Data sections. Then, save and go to the front-end.

Markers section

<marker id="labelSet0">Temperature</marker>
<marker id="labelSet1">Humidity</marker>
Copied!

Data section

        
<data id="dataSet0">
    20,22,24,20,19
</data>
<data id="dataSet1">
    55,50,51,53,60
</data>
<data id="labels">
    Monday, Tuesday, Wednesday, Thursdat, Friday            
</data>        
Copied!

Markers section

<c:marker id="labelSet0">Temperature</c:marker>
<c:marker id="labelSet1">Humidity</c:marker>
Copied!

Data section

        
<c:data id="dataSet0">
    20,22,24,20,19
</c:data>
<c:data id="dataSet1">
    55,50,51,53,60
</c:data>
<c:data id="labels">
    Monday, Tuesday, Wednesday, Thursdat, Friday            
</c:data>   

    
Copied!

Options 

Options are defined in the Chart.js documentation. They can be set by overloading the <data> tag associated with the options attribute of the chart. In the LineChart.xml template, for example, the chart is defined as follows:

<lineChart id="1" data="data#lineChartData" options="data#lineChartOptions" >
    ....
</lineChart>  
Copied!
<c:lineChart id="1" data="data__lineChartData" options="data__lineChartOptions" >
    ....
</c:lineChart> 
Copied!

The options attribute is a reference to the <data> tag whose ID is lineChartOptions.

Overloading this tag in the Data section of the Flexform will set the options. Assume that the Data section is still configured with a modified label. Add the following code to the Data section of the Flexform. This will cancel the animation, set a linear interpolation between points, and display the line a width of 10 points.

<data id="lineChartOptions" >
    <item key="animation"></item>
    <item key="elements">
        <item key="line">
            <item key="tension" value="0" />
            <item key="borderWidth" value="10" />
        </item>
    </item>
</data>  
Copied!
<c:data id="lineChartOptions" >
    <c:item key="animation"></c:item>
    <c:item key="elements">
        <c:item key="line">
            <c:item key="tension" value="0" />
            <c:item key="borderWidth" value="10" />
        </c:item>
    </c:item>
</c:data>  
Copied!

Using Advanced Templates 

SAV Charts provides more complex templates. They can display up to nine items on the same chart.

The colors are defined in a specific template, either DefaultColors.xml for the XML parser or FluidParser/DefaultColors.fluid for the Fluid parser. These colors were chosen to provide contrast between items.

To illustrate the use of advanced templates, consider the LineChartAdvanced.xml template or the FluidParser/LineChartAdvanced.fluid template.

Enter the following code in the template section, then save and go to the front end.

<template id="1">
    EXT:sav_charts/Resources/Private/Templates/ChartsExamples/LineChartAdvanced.xml
</template>  
Copied!
<c:template id="1">
    EXT:sav_charts/Resources/Private/Templates/ChartsExamples/FluidParser/LineChartAdvanced.fluid
</c:template> 
Copied!

The chart has nine superimposed curves with the same data, as well as predefined colors, labels, and a title. Click on the legend to hide a curve.

In the data section enter the following code, save, and go to the front-end.

<data id="data">
    <item key="0" values="10, 6, 7, 2, 1, 5, 3" />     
</data>  
Copied!
<c:data id="data">
    <c:item key="0" values="10, 6, 7, 2, 1, 5, 3" />     
</c:data>              
    
Copied!

Modify the data section as follows:

<data id="data">
    <item key="0" values="10, 6, 7, 2, 1, 5, 3" />
    <item key="1" values="5, 3, 8, 1, 6, 9, 2" />
</data>  

<data id="labels">
    1, 2, 3, 4, 5, 6, 7
</data>
Copied!
<c:data id="data">
    <c:item key="0" values="10, 6, 7, 2, 1, 5, 3" />
    <c:item key="1" values="5, 3, 8, 1, 6, 9, 2" />
</c:data>  

<c:data id="labels">
    1, 2, 3, 4, 5, 6, 7
</c:data>
                
Copied!

Enter the following code in the marker section, then save and go to the front-end.

<marker id="title">A line chart with two curves</marker> 
<marker id="labelSet0">Curve 1</marker> 
<marker id="labelSet1">Curve 2</marker> 
Copied!
<c:marker id="title">A line chart with two curves</c:marker> 
<c:marker id="labelSet0">Curve 1</c:marker> 
<c:marker id="labelSet1">Curve 2</c:marker> 

 
Copied!

Using and Developing Query Managers 

Query managers are used in <query> tags to execute queries that can be used in charts.

The SAV Charts extension comes with an internal query manager named savcharts that can handle TYPO3 database queries as well as queries from other databases.

Using the Query Manager 

In the backend in Records mode create a new record in a page or a folder.

Select Database if you need to access to an external database, fill the different fields and save.

Select Query to create a query. Select a database (default is TYPO3 Database), fill the different clauses and save.

The following configuration is an example of how to obtain the number of pages created per year.

  • In SELECT clause field

    COUNT(*) AS Count,
    YEAR(FROM_UNIXTIME(crdate)) AS Year
    Copied!
  • In FROM clause field

    pages
    Copied!
  • In WHERE clause field

    NOT deleted AND NOT hidden
    Copied!
  • In GROUP BY clause field

    year
    Copied!

The following query is generated by this configuration.

SELECT
    COUNT(*) AS Count,
    YEAR(FROM_UNIXTIME(crdate)) AS Year
FROM
    pages
WHERE
    NOT deleted AND NOT hidden
GROUP BY
    Year
Copied!

If the new query has ID 1, the following FlexForm configurations will display a bar chart showing the number of pages per year.

  • In the Markers Flexform field

    <marker id="title">Analysis of the site</marker>
    <marker id="labelSet0">Pages per year</marker>                
    Copied!
    <c:marker id="title">Analysis of the site</c:marker>
    <c:marker id="labelSet0">Pages per year</c:marker>
    Copied!
  • In the Queries Flexform field

    <query id="1">
        <setQueryManager name="savcharts" uid="1" />
    </query>
    Copied!
    <c:query id="1"  manager="savcharts" uid="1" />
    Copied!
  • In the Data Flexform field

    <data id="data0" >
      <setDataFromQuery query="1" field="Count" />
    </data>
    <data id="labels" >
      <setDataFromQuery query="1" field="Year" />
    </data>
    <data id="data">
      <item key="0" value="data#data0" />
    </data>
    Copied!
    <c:data id="labels" values="{query__1.Year}" />
    
    <c:data id="data">
      <c:item key="0" value="{query__1.Count}" />
    </c:data>
    Copied!
  • In the Templates Flexform field

    <template id="1">
        EXT:sav_charts/Resources/Private/Templates/ChartsExamples/BarChartAdvanced.xml
    </template>
    Copied!
    <c:template id="1">
        EXT:sav_charts/Resources/Private/Templates/ChartsExamples/FluidParser/BarChartAdvanced.fluid
    </c:template>
    Copied!

The default query manager, savcharts, is used in the Queries section. It calls the query with the UID 1.

The Data section of the FlexForm overloads the template to display a single bar chart with data from the query, as explained in Using Advanced Templates.

Go to the front-end to view the resulting chart.

Using Markers in Queries 

Markers can be used in queries. For example, assume that the previous query should return the number of pages created between the years yearMin and yearMax.

First, insert the syntax ###marker### into the WHERE clause of the previous content element in the query.

NOT deleted AND NOT hidden AND YEAR(FROM_UNIXTIME(crdate)) BETWEEN ###yearMin### AND ###yearMax###
Copied!

Add markers to the Flexform field of your chart, then save and go to the front-end.

<marker id="title">Analysis of the site</marker>
<marker id="labelSet0">Pages per year</marker>

<marker id="yearMin">2010</marker>
<marker id="yearMax">2020</marker>
Copied!
<c:marker id="title">Analysis of the site</c:marker>
<c:marker id="labelSet0">Pages per year</c:marker>

<c:marker id="yearMin">2010</c:marker>
<c:marker id="yearMax">2020</c:marker>            
Copied!

You can also introduce markers in TypoScript. For example, add the following TypoScript to your page to modify only the value of the ###yearMin### marker, then clear the cache and go to the front-end. The syntax customQuery.1 refers to the query with the UID of 1.

plugin.tx_savcharts.settings.customQuery.1 {
  yearMin = TEXT
  yearMin.value = 2009
}    
Copied!

Developing Your Query Manager 

Query managers are implemented by means of hooks.The hook for the internal query manager is in Classes/Hooks/SavChartsQueryManager.php. This class extends the abstract class AbstractQueryManager (Classes/Hooks/AbstractQueryManager.php) which itself implements the interface QueryManagerInterface (Classes/Hooks/QueryManagerInterface.php).

You can develop your own query manager by providing a hook which must be added in the file ext_localconf.php of your extension.

Assuming that your vendor name is MyVendorName and your extension name is my_extension. Assuming also that you have written your manager as the class MyQueryManager in Classes/Hooks/MyQueryManager.php. Finally, assuming that you want to name your query manager myManager, you should add the following code in ext_localconf.php of your extension.

$TYPO3_CONF_VARS['EXTCONF'][$_EXTKEY]['queryManagerClass']['myManager'] = \MyVendorName\MyExtension\Hooks\MyQueryManager::class;
Copied!

Exporting Data in CSV 

You can easily export data associated with any chart using the exportCSV method associated with the <charts> tag (see Chart Tags).

Assuming that you want to export data associated with the line chart template with a row header containing the x-axis labels and a column header containing the legend labels of the two curves. Add the following code to the Templates field of the Flexform.

<template id="1">
    EXT:sav_charts/Resources/Private/Templates/ChartsExamples/LineChart.xml
</template>

<data id="data">
  <item key="0" value="data#dataSet0" />
  <item key="1" value="data#dataSet1" />    
</data>

<data id="exportRowHeader">
  <item key="0" value="marker#labelSet0" />
  <item key="1" value="marker#labelSet1" />
</data>
                
<exportCSV reference="lineChart#1" rowHeader="data#exportRowHeader" columnHeader="data#labels" data="data#data" />
Copied!
<c:template id="1">
    EXT:sav_charts/Resources/Private/Templates/ChartsExamples/FluidParser/LineChart.fluid
</c:template>

<c:data id="data">
  <c:item key="0" value="{data__dataSet0}" />
  <c:item key="1" value="{data__dataSet1}" />   
</c:data>

<c:data id="exportRowHeader">
  <c:item key="0" value="{marker__labelSet0}" />
  <c:item key="1" value="{marker__labelSet1}" />
</c:data>

<c:exportCSV fileName="LineChart_1.csv" rowHeader="{data__exportRowHeader}" columnHeader="{data__labels}" data="{data__data}" />             
Copied!

The CSV file is saved in typo3temp/sav_charts.

With the XML parser, the file name is img_ContentId_ChartNumber, where ContentId is the UID of the content element and ChartNumber is the ID of the chart, starting from 0. In the front-end you should see an icon to open the file.

With the Fluid parser, the file name is provided in the argument fileName.

Converting Basic XML Templates to Fluid Templates 

Introduction 

The conversion process is quite simple.

  • Prefix all tags with c:.
  • References are written as tag__id instead of tag#id. This change is because the character # is not permitted in Fluid variable names.
  • To get the value associated with a reference, use the conventional Fluid accessor for variables, i.e. {tag__id}.

See Designing Templates from Examples.

Converting Advanced XML Templates to Fluid Templates 

Advanced templates are designed to display multiple sets of data on the same chart. Between one and nine sets of data can be displayed on the same chart.

As colour label sets and data sets are built iteratively, a special "<for>" was introduced in the XML parser. This leads to complex statements and poor readability.

In Fluid-based templates, however, conventional Fluid syntax and viewHelpers can be used. Therefore, using the "<f:for>" viewHelper greatly improves readability.

Let us illustrate this point with part of the "LineChartsAdvanced.xml" template. The "<for>" tags in the following excerpt contain data with ids "data" and "labels", as well as intermediate data tags with ids "initData" and "initLabels", which are used to build them.

The Fluid-based version uses simpler code thanks to the "<f:for>" viewHelper.

<!-- Defines the data -->
<for id="initData" each="data#lowIntensityColors">
    <data id="initData" overload="1">
        <item key="for#initData:key" value="data#sampleData" />
    </data>
</for>
<data id="data">
    <setData values="data#initData" />
</data>

<!-- Defines the labels -->
<for id="initLabels" each="data#data">
    <marker id="labelSetId" overload="1">
        <setMarkerByPieces part1="labelSet" part2="for#initLabels:key" />
    </marker>
    <marker id="marker#labelSetId">
        <setMarkerByPieces part1="Label " part2="for#initLabels:key" />
    </marker>
</for>
Copied!
<!-- Defines the data -->
<c:data id="data">
    <f:for each="{data__lowIntensityColors}" as="color" key="key">
        <c:item key="{key}" value="{data__sampleData}" />
    </f:for>
</c:data>

<!-- Defines the labels for the set -->
<f:for each="{data__data}" as="value" key="key"> 
    <c:marker id="labelSet{key}" value="labelSet {key}"/>       
</f:for> 
Copied!

Similarly, the following excerpt shows how data with the id "dataSets" were set, using markers with ids "setId" and "labelSetId". They are needed to generate new markers with ids "labelSet0", "labelSet1"... and the items with ids 0, 1... for "dataSets".

Once again, Fluid syntax makes it simpler because accessors can be used in accessors. For example, "{data__lowIntensityColors.{key}}" returns the value at the position given by "key" in the data with the id "lowIntensityColors".

         
<!-- Defines the sets -->
<for id="initSets" each="data#data">     
    <marker id="setId" overload="1">
        <setMarkerByPieces part1="set" part2="for#initSets:key" />                
    </marker>  
    <marker id="labelSetId" overload="1">
        <setMarkerByPieces part1="labelSet" part2="for#initSets:key" />                
    </marker>
          
    <data id="marker#setId">
        <item key="label" value="marker#marker#labelSetId" />
        <item key="backgroundColor" value="data#lowIntensityColors:for#initSets:key" />
        <item key="borderColor" value="data#fullIntensityColors:for#initSets:key" />                
        <item key="pointColor" value="data#middleIntensityColors:for#initSets:key" />
        <item key="pointBackgroundColor">#fff</item>
        <item key="pointHoverBackgroundColor" value="data#fullIntensityColors:for#initSets:key" />
        <item key="lineTension" value="false" />
        <item key="data" value="for#initSets:value" />
    </data> 
    <data id="dataSets" overload="1">
        <item key="for#initSets:key" value="data#marker#setId" />
    </data>                         
</for>
Copied!
  
<!-- Defines the sets -->
<c:data id="dataSets">
    <f:for each="{data__data}" as="value" key="key">
        <c:item key="{key}">
            <c:item key="label" value="{marker__labelSet{key}}" />
            <c:item key="backgroundColor" value="{data__lowIntensityColors.{key}}" />
            <c:item key="borderColor" value="{data__fullIntensityColors.{key}}" />                
            <c:item key="pointColor" value="{data__middleIntensityColors.{key}}" />
            <c:item key="pointBackgroundColor">#fff</c:item>
            <c:item key="pointHoverBackgroundColor" value="{data__fullIntensityColors.{key}}" />
            <c:item key="lineTension" value="false" />
            <c:item key="data" value="{data__data.{key}}" />
        </c:item>
    </f:for>
</c:data>
Copied!

Including Charts in HTML Templates 

SAV Charts viewHelpers can be used in any HTML template processed by Fluid.

The following example illustrates how to integrate a bar chart that displays the number of pages created per year (see Using and Developing Query Managers).

{namespace c=YolfTypo3\SavCharts\ViewHelpers}
<c:marker id="title">Analysis of the site</c:marker>
<c:marker id="labelSet0">Pages per year</c:marker>
<c:query id="1"  manager="savcharts" uid="1" />
<c:data id="labels" values="{query__1.Year}" />
<c:data id="data">
  <c:item key="0" value="{query__1.Count}" />
</c:data>
<c:template id="1">
    EXT:sav_charts/Resources/Private/Templates/ChartsExamples/FluidParser/BarChartAdvanced.fluid
</c:template>

<canvas id="canvas{canvases.0.chartId}" width="{canvases.0.width}" height="{canvases.0.height}"></canvas>
Copied!

Frequently Asked Questions 

How to Generate a Boolean Value? 

Set the attribute value to true or false.

<data id="barChartOptions">
    <item key="animation" value="false" />
    <item key="responsive" value="false" />
    <item key="plugins">
        <item key="title">
            <item key="display" value="true" />
            <item key="text" value="marker#title" />
        </item>
        <item key="tooltip">
            <item key="backgroundColor">rgba(0,0,0,0.7)</item>
        </item>
    </item>                        
</data>   
Copied!
<c:data id="barChartOptions">
    <c:item key="animation" value="false" />
    <c:item key="responsive" value="false" />
    <c:item key="plugins">
        <c:item key="title">
            <c:item key="display" value="true" />
            <c:item key="text" value="{marker__title}" />
        </c:item>
        <c:item key="tooltip">
            <c:item key="backgroundColor">rgba(0,0,0,0.7)</c:item>
        </c:item>
    </c:item>                        
</c:data>                
   
Copied!

How to Set the y-Axis Properties? 

You can change the default y-axis (or x-axis) properties using the options for the chart. For example, assume that the y-axis for the lineChart example has to be changed so that the minimum is 10, the maximum is 100 and the step is 5.

Add the following configuration in the data section or in your template.

<data id="lineChartOptions">
    <item key="scales"> 
        <item key="y">
            <item key="max" value="100" />
            <item key="min" value="10" />
            <item key="ticks">   
                <item key="stepSize" value="5" />
            </item>
        </item>
    </item>
</data> 
Copied!
<c:data id="lineChartOptions">
    <c:item key="scales"> 
        <c:item key="y">
            <c:item key="max" value="100" />
            <c:item key="min" value="10" />
            <c:item key="ticks">   
                <c:item key="stepSize" value="5" />
            </c:item>
        </c:item>
    </c:item>
</c:data> 
Copied!

Save, clear the cache and go to the front-end.

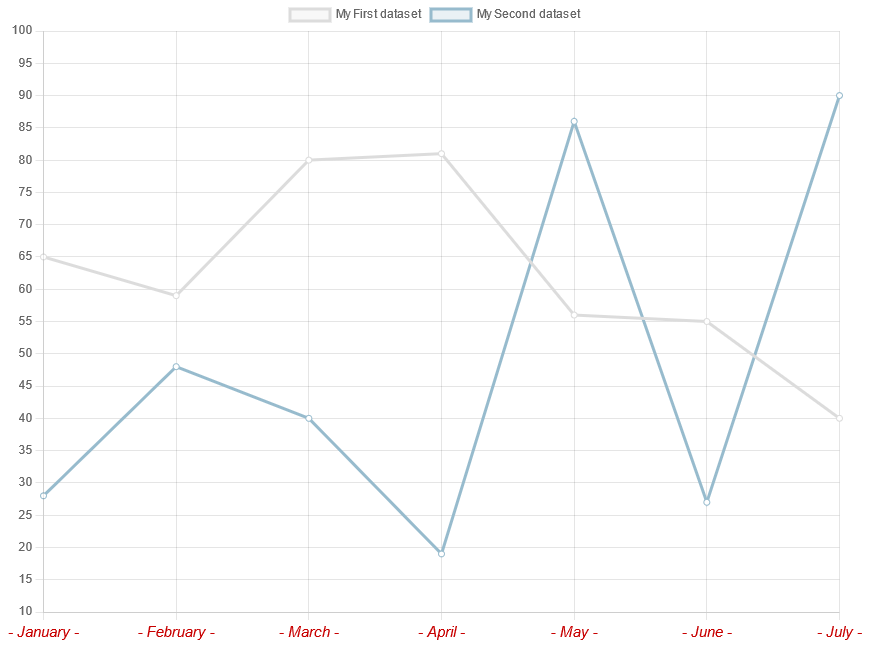
For example, the following code changes also the label style of the x-axis. A callback is used to modify the tick labels.

<data id="lineChartOptions">
    <item key="scales"> 
        <item key="y">
            <item key="max" value="100" /> 
            <item key="min" value="10" />
            <item key="ticks">      
                <item key="stepSize" value="5" />
            </item>
        </item>
        <item key="x">
            <item key="ticks">
                <item key="font">
                    <item key="size" value="15" />
                    <item key="tyle" value="italic" />
                </item>
                <item key="color" value="rgb(200, 0, 0)" />
                <callback key="callback">
                    <!--
                    function(value, index, values) {
                        return '- ' + this.getLabelForValue(value) + ' -';
                    }
                    -->
                </callback>
            </item>
        </item>
    </item>
</data>
Copied!
<c:data id="lineChartOptions">
    <c:item key="scales"> 
        <c:item key="y">
            <c:item key="max" value="100" /> 
            <c:item key="min" value="10" />
            <c:item key="ticks">      
                <c:item key="stepSize" value="5" />
            </c:item>
        </c:item>
        <c:item key="x">
            <c:item key="ticks">
                <c:item key="font">
                    <c:item key="size" value="15" />
                    <c:item key="tyle" value="italic" />
                </c:item>
                <c:item key="color" value="rgb(200, 0, 0)" />
                <c:callback key="callback">
                    function(value, index, values) {
                        return '- ' + this.getLabelForValue(value) + ' -';
                    }
                </c:callback>
            </c:item>
        </c:item>
    </c:item>
</c:data>
Copied!

How to Modify the Tooltip Format? 

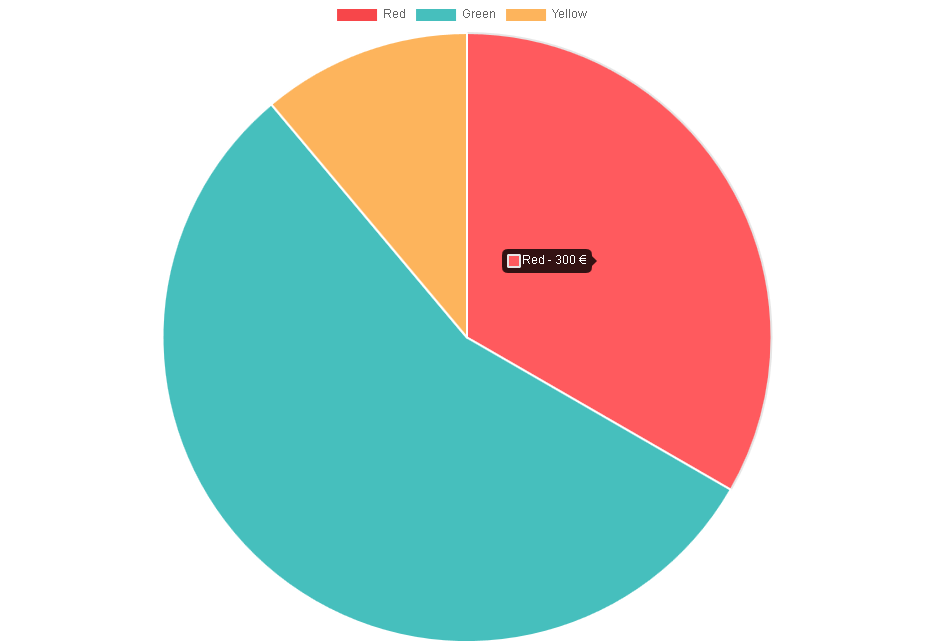
The tooltip format can be modified using callbacks that are provided with Chart.js. For example let us assume that data provided with the Pie Chart example are in €. Let us also assume that we want to change the tiptool content in order to have label - value € instead of the defaut format label:value.

Chart.js library allows to modify several behaviors by means of callbacks. Please consult the Chart.js documentation for details.

The tooltip label can been changed by means of the label callback in tooltip options.

Inline JavaScript Function 

Add the following configuration in the data section or in your template.

<data id="pieChartOptions">
    <item key="plugins">
        <item key="tooltip">
            <item key="callbacks">
                <callback key="label">
                    <!--
                    function(context) {
                        return context.label + ' - ' + context.formattedValue + ' €';
                    }
                    -->
                </callback>
            </item>
        </item>
    </item>   
</data>
Copied!
<c:data id="pieChartOptions">
    <c:item key="plugins">
        <c:item key="tooltip">
            <c:item key="callbacks">
                <c:callback key="label">
                    function(context) {
                        return context.label + ' - ' + context.formattedValue + ' €';
                    }
                </c:callback>
            </c:item>
        </c:item>
    </c:item>   
</c:data>
Copied!

Save, clear the cache and go to the front-end.

The configuration is simply the translation of the following JavaScript configuration.

    
options: {
    plugins: { 
        tooltip: {
            callbacks: {
                label: function(context) {
                    return context.label + ' - ' + context.formattedValue + ' €';
                }
            }
        }
    }
}
Copied!

JavaScript Function in a File 

When the JavaScript function associated with the callback is more complex, you can also put it in a file and call that file in the callback as shown in the following configuration.

<data id="pieChartOptions">
    <item key="plugins">
        <item key="tooltip">
            <item key="callbacks">
                <callback key="label">
                    EXT:sav_charts/Resources/Public/Callbacks/TooltipLabel.js                                
                </callback>
            </item>
        </item>
    </item>   
</data>
Copied!
<c:data id="pieChartOptions">
    <c:item key="plugins">
        <c:item key="tooltip">
            <c:item key="callbacks">
                <c:callback key="label">
                    EXT:sav_charts/Resources/Public/Callbacks/TooltipLabel.js                                
                </c:callback>
            </c:item>
        </c:item>
    </c:item>   
</c:data>            
Copied!

How to call a JavaScript Function on Events? 

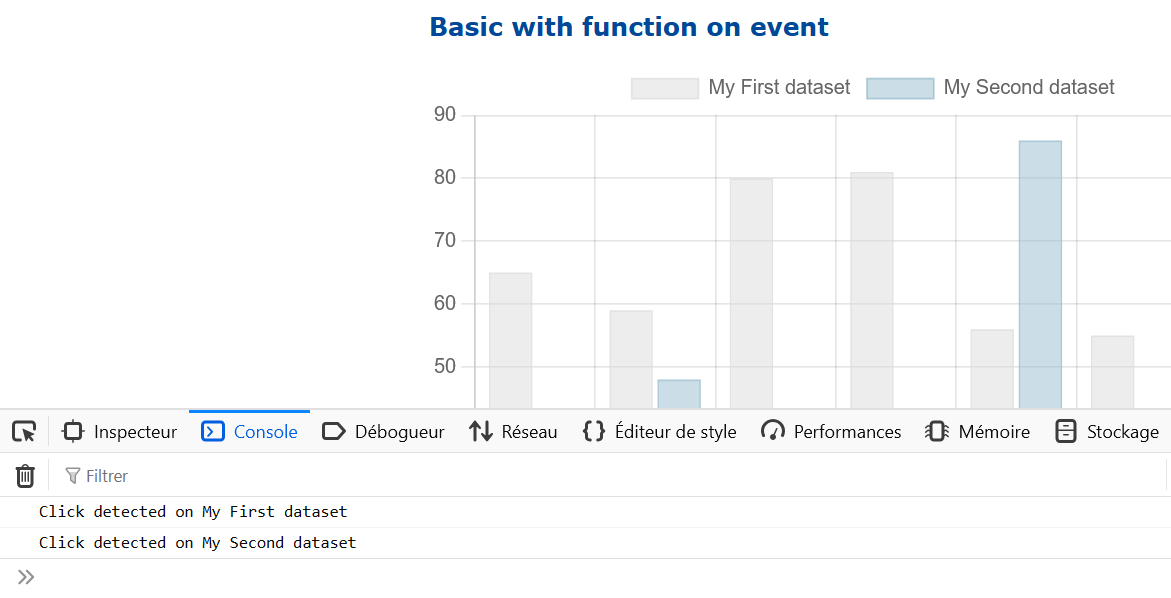
The following configuration shows how to associate the JavaScript function newLegendClickHandler with the onClick event of the legend.

<data id="barChartOptions">
    <item key="plugins">
        <item key="legend">
            <item key="onClick" type="function" value="newLegendClickHandler" />
        </item> 
    </item>                        
</data>  

<template id="1">
    EXT:sav_charts/Resources/Private/Templates/ChartsExamples/BarChart.xml
</template> 
Copied!
<c:data id="barChartOptions">
    <c:item key="plugins">
        <c:item key="legend">
            <c:callback key="onClick">newLegendClickHandler</c:callback>
        </c:item> 
    </c:item>                        
</c:data> 

<c:template id="1">
    EXT:sav_charts/Resources/Private/Templates/ChartsExamples/FluidParser/BarChart.fluid
</c:template>                  
Copied!

The function newLegendClickHandler is available in ResourcesPublicCallbacksNewLegendClickHandler.js and must be inserted by TypoScript.

page.includeJSFooter{
    newLegendClickHandler = EXT:sav_charts/Resources/Public/Callbacks/NewLegendClickHandler.js
}      
Copied!

Open the console and click on the chart legend.

How to Create a Combination Chart? 

An example which combines a bar chart and a line chart is provided in the directory Resources/Private/Templates/ChartsExamples. Create a new graph then, in the template section, enter the following code, save and go to the front-end.

<template id="1">
    EXT:sav_charts/Resources/Private/Templates/ChartsExamples/ComboChart.xml
</template>     
Copied!
<c:template id="1">
    EXT:sav_charts/Resources/Private/Templates/ChartsExamples/ComboChart.xml
</c:template>  
Copied!

The file ComboChart.xml is very similar to the file BarChart.xml. Only slight changes were made. The type attribute of the second dataset is set to line and the fill attribute to false.

<data id="set1">
    <item key="type">line</item>
    <item key="fill" value="false"/>
        ...
</data>
Copied!
<c:data id="set1">
    <c:item key="type">line</c:item>
    <c:item key="fill" value="false"/>
        ...
</c:data>
Copied!

The value for the type attribute of each chart is given in the Chart.js documentation.

How to use Plugins? 

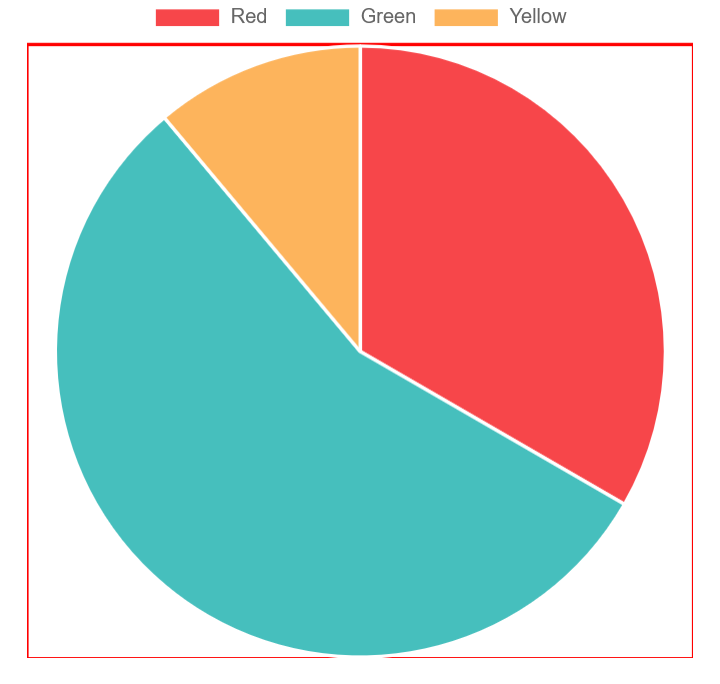
A plugin to draw a border around the chart is available in ResourcesPublicPluginsCharAreaBorder.js.

<plugin chartId="pieChart#1" key="chartAreaBorder" fileName="EXT:sav_charts/Resources/Public/Plugins/ChartAreaBorder.js" />

<data id="pieChartOptions">
  <item key="plugins">
    <item key="chartAreaBorder">
      <item key="borderColor">red</item>
      <item key="borderWidth">2</item>
    </item>
  </item>
</data>
  
<template id="1">
    EXT:sav_charts/Resources/Private/Templates/ChartsExamples/PieChart.xml
</template>
Copied!
<c:plugin chartId="pieChart__1" key="chartAreaBorder" fileName="EXT:sav_charts/Resources/Public/Plugins/ChartAreaBorder.js" />

<c:data id="pieChartOptions">
  <c:item key="plugins">
    <c:item key="chartAreaBorder">
      <c:item key="borderColor">red</c:item>
      <c:item key="borderWidth">2</c:item>
    </c:item>
  </c:item>
</c:data>

<c:template id="1"> 
    EXT:sav_charts/Resources/Private/Templates/ChartsExamples/FluidParser/PieChart.fluid
</c:template>
Copied!

Entity Relationship Diagram 

sav_charts tx_savcharts_domain_model_database tx_savcharts_domain_model_database uid pid tstamp crdate cruser_id sorting deleted hidden title driver tables host port socket name username userpassword persistent tx_savcharts_domain_model_query tx_savcharts_domain_model_query uid pid tstamp crdate cruser_id sorting deleted hidden title database_id select_clause from_clause where_clause groupby_clause orderby_clause limit_clause tx_savcharts_domain_model_database:uid->tx_savcharts_domain_model_query:database_id

The Entity Relationship Diagram is generated by the SAV Library Kickstarter in Graphviz DOT language and included using PlantUML.

  • New tables with their fields are represented with a Black border.
  • Existing tables are represented with a Dark green border. Only existing fields uid and pid are shown. If new fields are created, they are shown in Light blue.
  • 1-n relations are in Dark blue.
  • n-n relationships are in Dark red with the name of the associated mm table.

Changelog 

Version Changes
14.5.0
  • New parser based on Fluid and viewHelpers added.
  • Version of Chart.js changed to 4.5.1.
14.4.0
  • Compatibility changed to TYPO3 13.4.x and 14.3.x.
13.4.0
  • Compatibility changed to TYPO3 12.4.x and 13.4.x.
  • Version of Chart.js changed to 4.4.5.
11.5.0
  • Compatibility changed to TYPO3 11.5.x.
  • Version of Chart.js changed to 3.6.0.
11.2.0
  • Compatibility changed to TYPO3 11.2.x.
  • Version of Chart.js changed to 3.2.1.
  • Scatter graph added with example.
  • Combination graph example added.
10.4.0
  • Compatibility changed to TYPO3 10.4.x.
10.3.0
  • Compatibility changed to TYPO3 10.3.x.
  • Version of Chart.js changed to 2.9.3.
  • True or false values and use of functions outside callbacks added (issue #1).
9.5.0
  • Version of Chart.js changed to 2.9.2.
  • Compatibility changed to TYPO3 9.5.x.
  • Documentation updated to docker.
0.5.0
  • Version of Chart.js changed to 2.7.0.
  • Compatibility to TYPO3 6.2 removed.
  • Compatibility changed to TYPO3 9.0.
0.4.0
  • Version of Chart.js changed to 2.7.0.
  • composer.json added.
  • Vendor name changed.
0.3.2
  • Default type for stacked option changed to boolean.
0.3.1
  • Small bug corrected in the use of file callback functions (thanks to Holger Birkner for reporting this bug).
0.3.0
  • Processing of callback functions and plugins added.
  • Documentation updated.
  • Version of Chart.js changed to 2.5.0.
0.2.1
  • Documentation updated.
  • Version of Chart.js changed to 2.4.0.
  • Compatibility changed to TYPO3 8.9.
0.2.0
  • BeginAtZero becomes the default option for line charts.
  • Subitems may contain data items like setDataFromQuery.
  • New templates added for horizontal bar charts, horizontal stacked bar charts and bubble bar charts.
  • Compatibility changed to TYPO3 8.3.
  • Version of Chart.js changed to 2.2.2
0.1.0
  • SAV Charts modified for Version 2.1.6 of Chart.js
  • Advanced templates added.
0.0.2
  • Small changes to remove the use of deprecated methods.
  • Compatibility changed to TYPO3 8.0.
0.0.1
  • 1st public release.

Sitemap