
Designing XML Templates From Examples
Introduction
The chart.js documentation provides examples for the different charts.
The SAV Charts extension comes with templates for all chart types.
These templates are in the directory
Resources/Private/Templates/ChartExamples of the extension.
To display a template, simply create a SAV Charts plugin content element in a page.
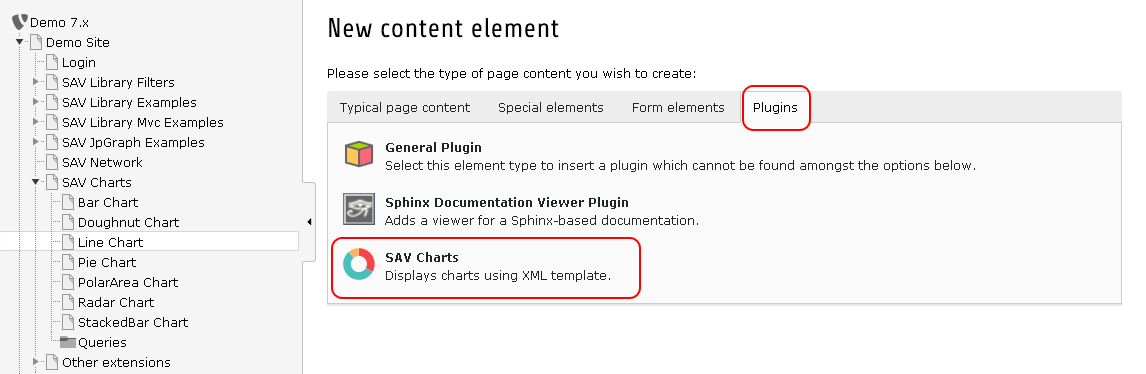
Then click on the plugin tab.
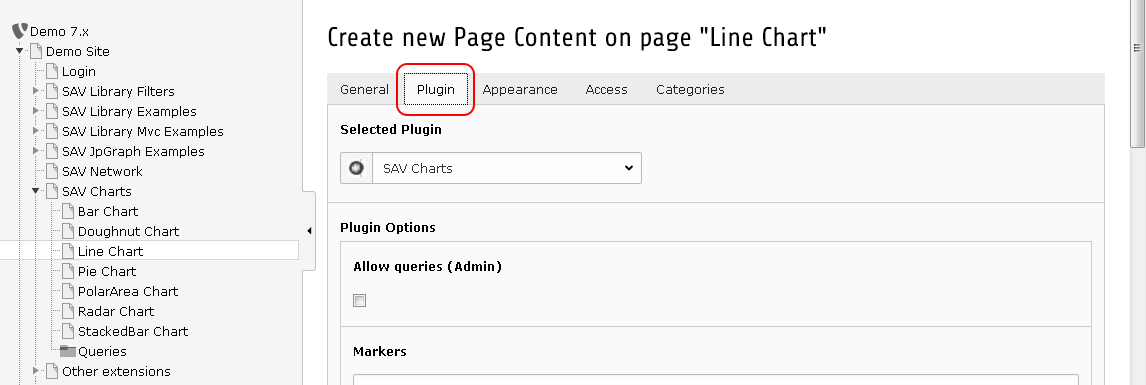
Fill the template field of the flexform and save.
Important
Use the EXT: prefix to reference the template file from the extension.
<template id="1">
   EXT:sav_charts/Resources/Private/Templates/ChartsExamples/LineChart.xml
</template> 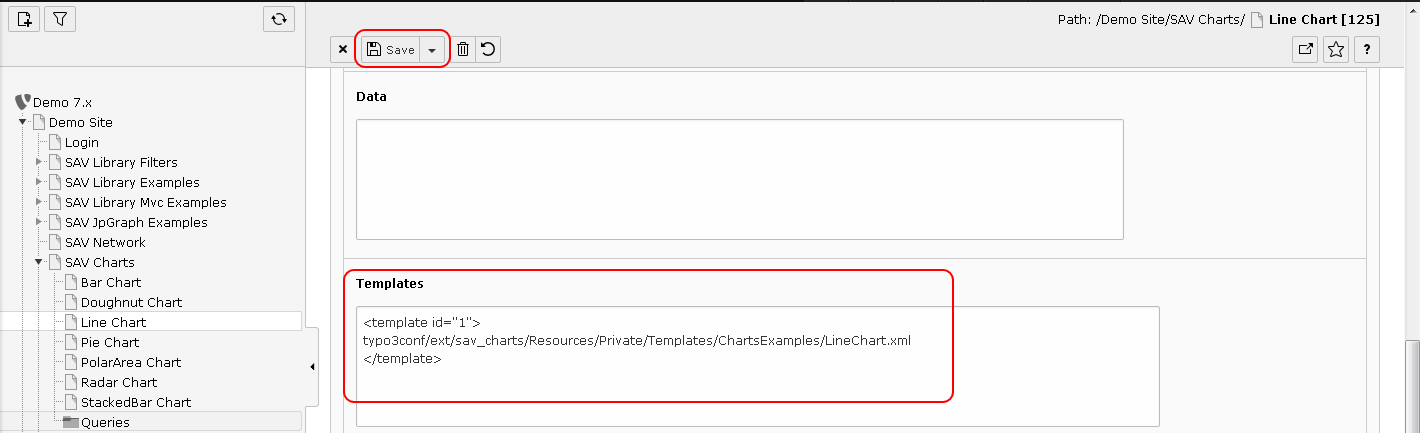
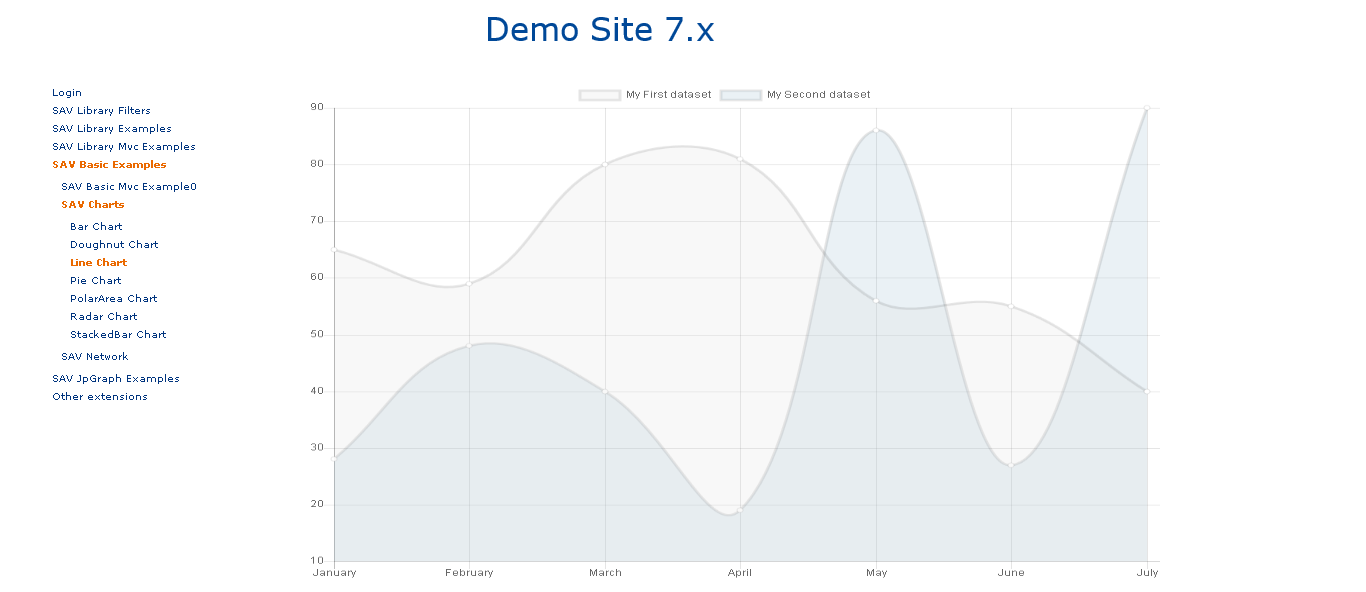
Go to the frontend and you should see the following image.
Writing Templates
The templates provided with the extension were adpated from the examples given in the chart.js documentation. Let us illustrate the principle for the line chart.
The javascript code to display the line graph is the following:
var data = {
   labels: ["January", "February", "March", "April", "May", "June", "July"],
   datasets: [
      {
         label: "My First dataset",
         fillColor: "rgba(220,220,220,0.2)",
         strokeColor: "rgba(220,220,220,1)",
         pointColor: "rgba(220,220,220,1)",
         pointStrokeColor: "#fff",
         pointHighlightFill: "#fff",
         pointHighlightStroke: "rgba(220,220,220,1)",
         data: [65, 59, 80, 81, 56, 55, 40]
      },
      {
         label: "My Second dataset",
         fillColor: "rgba(151,187,205,0.2)",
         strokeColor: "rgba(151,187,205,1)",
         pointColor: "rgba(151,187,205,1)",
         pointStrokeColor: "#fff",
         pointHighlightFill: "#fff",
         pointHighlightStroke: "rgba(151,187,205,1)",
         data: [28, 48, 40, 19, 86, 27, 90]
      }
   ]
};The template is built by transforming this javascript code into a
XML structure using the <data> tag. By doing so, thanks to the
data tag id, references can be used.
References provide an easy means to split the data and therefore
to make it possible to have them overloaded in the flexform data section or with queries.
The following code is the translation in XML of the previous
javascript code where <data> tags whose id are labels, dataSet1 and dataSet2
can be easily overloaded as explained in the next section.
<?xml version="1.0" encoding="UTF-8"?>
<charts>
   <lineChart id="1" data="data#lineChartData" options="data#lineChartOptions" >

      <marker id="labelSet0">My First dataset</marker>
      <marker id="labelSet1">My Second dataset</marker>

      <data id="labels">
         January, February, March, April, May, June, July
      </data>

      <data id="dataSet0">
         65, 59, 80, 81, 56, 55, 40
      </data>

      <data id="dataSet1">
         28, 48, 40, 19, 86, 27, 90
      </data>

      <data id="set0">
         <item key="label" value="marker#labelSet0" />
         <item key="backgroundColor">rgba(220,220,220,0.2)</item>
         <item key="pointColor">rgba(220,220,220,1)</item>
         <item key="pointBackgroundColor">#fff</item>
         <item key="pointHoverBackgroundColor">rgba(220,220,220,1)</item>
         <item key="data" value="data#dataSet0" />
      </data>

      <data id="set1">
         <item key="label" value="marker#labelSet12" />
         <item key="backgroundColor">rgba(151,187,205,0.2)</item>
         <item key="pointColor">rgba(151,187,205,1)</item>
         <item key="pointBackgroundColor">#fff</item>
         <item key="pointHoverBackgroundColor">rgba(151,187,205,1)</item>
         <item key="data" value="data#dataSet1" />
      </data>

      <data id="dataSets">
         <item key="0" value="data#set0" />
         <item key="1" value="data#set1" />
      </data>

      <data id="lineChartData">
         <item key="labels" value="data#labels" />
         <item key="datasets" value="data#dataSets" />
      </data>

      <data id="lineChartOptions">
      </data>

   </lineChart>
</charts>Tip
<data> were inserted inside the <lineChart> tag just by personal choice.
They could have been provided before
the <lineChart> tag. In that case, this tag would have no content
and would simply be written:
<lineChart id="1" data="data#lineChartData" options="data#lineChartOptions" />
Overloading Data
Open the plugin in the backend and fill the Data section of the flexform as follows and save:
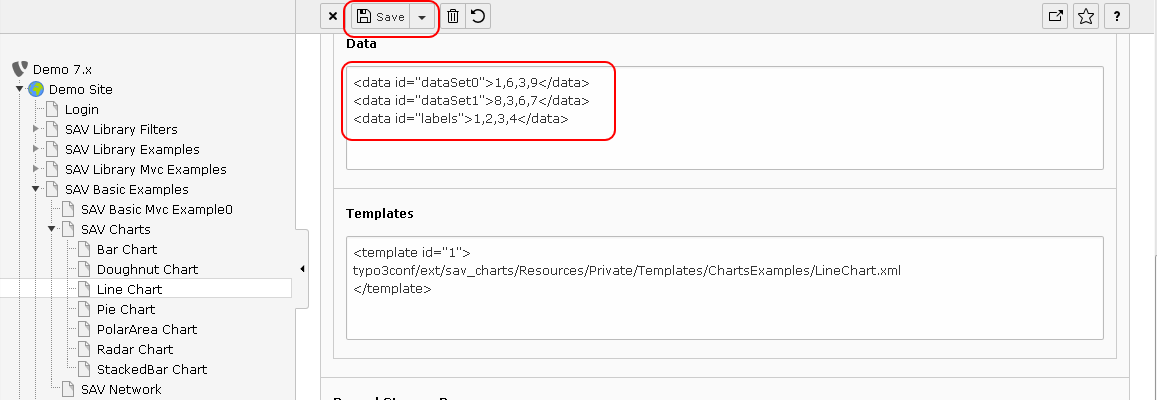
Go in the frontend and you should see the following figure.
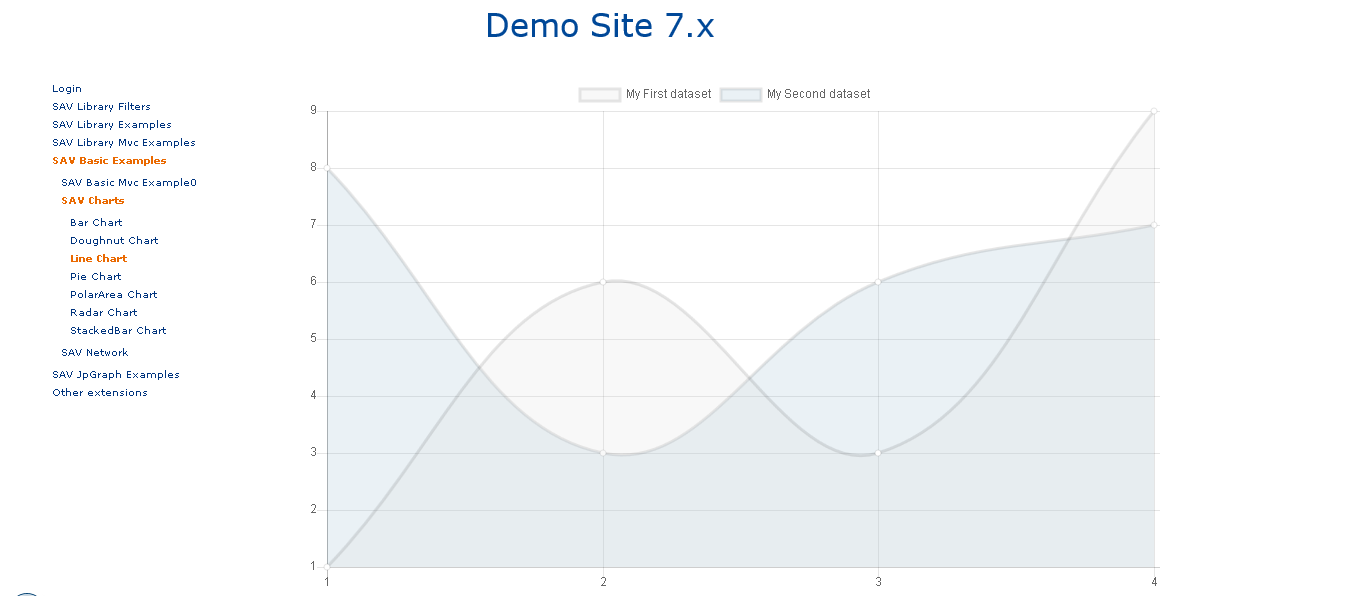
The principle in SAV Charts is to consider that for a given tag
with a given id the first definition is the first one to use. Therefore, in the
previous example, since <data> tag for id dataSet0 and dataSet1
are defined in the data section, which is
before the template section, they will not be replaced by the
same <data> tags in the template. One may consider
that the <data> tags in the data section overloads the same tags in the template.
It provides a quite simple way of working with generic templates and
adapting their behavior with your real data.
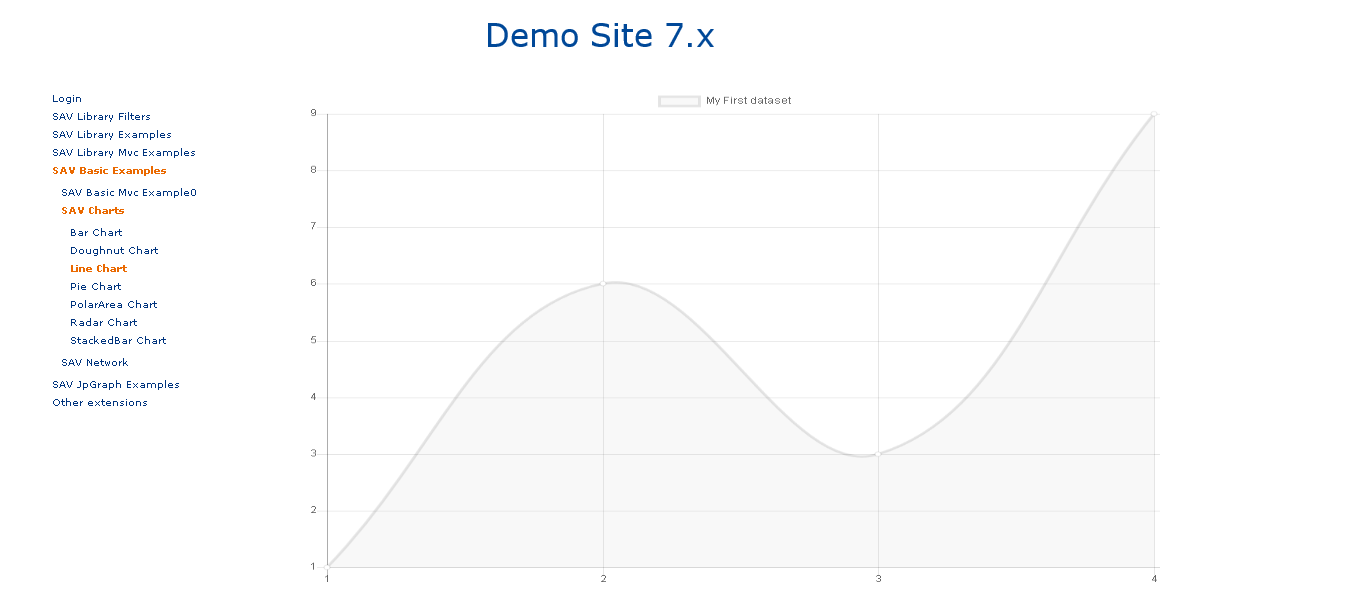
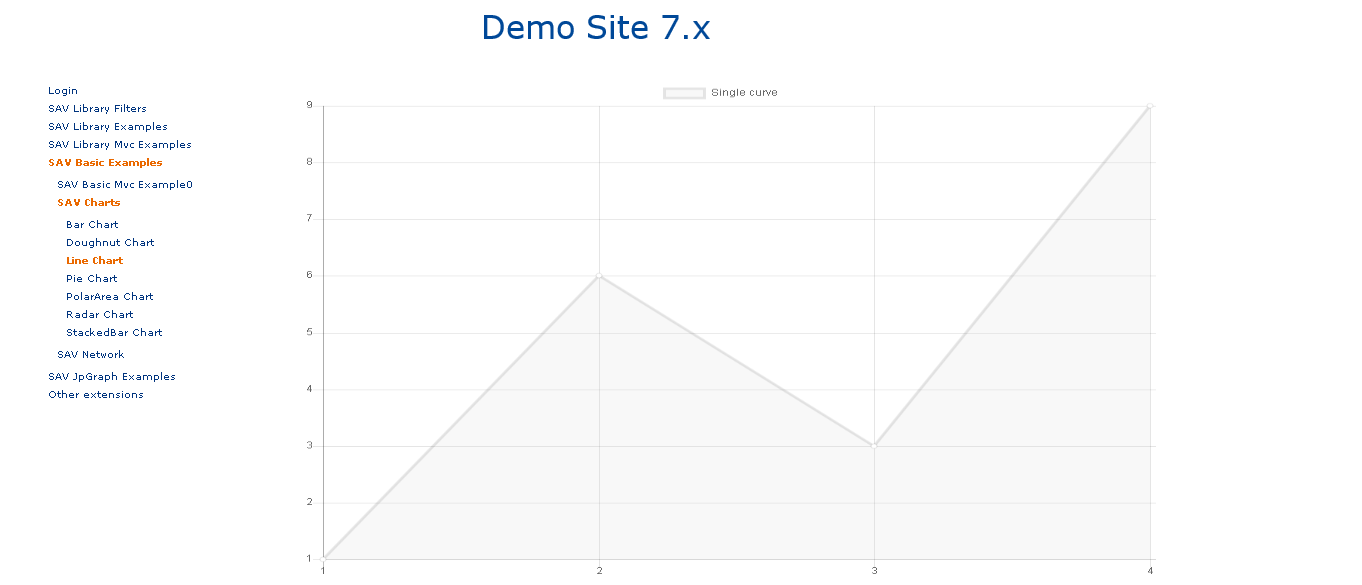
For example, using the same template LineChart.xml, you may want
to display only one curve.
It can simply be done by defining the <data> tag whose id is
dataSets in the data section as shown below.
<data id="dataSet0">1,6,3,9</data>
<data id="labels">1,2,3,4</data>
   <data id="dataSets">
      <item key="0" value="data#set0" />
</data>
Enter the previous code in the flexform data section, save and go to the frontend.
Note
In very specific cases you may explicitly allow to overload a given tag
by setting the attribute overload to 1. See
Resources/Private/Templates/ChartExamples/LineChartAdvanced.xml in which this
feature is used to build a flexible template.
Overloading Markers
Markers are tags which can be used to create strings. In the line chart
template two markers are used to define labels
which are displayed in the legend. The markers can be overloaded in the
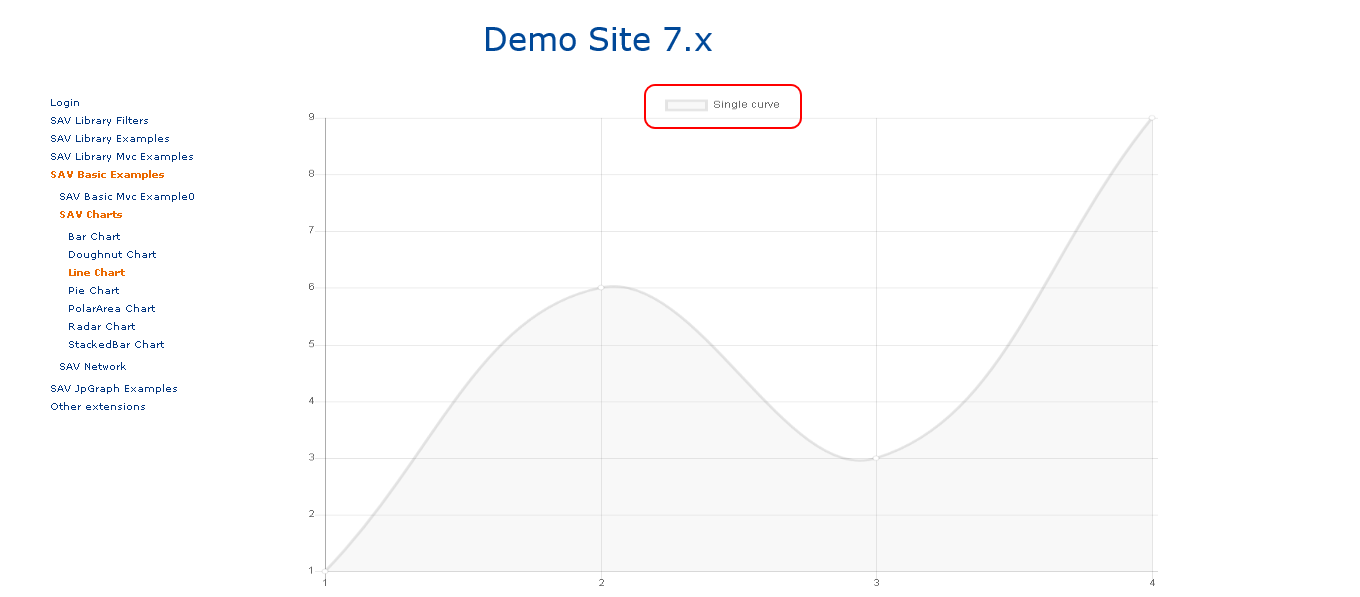
Markers section of the flexform. Assuming that you have
the previous code to display only one line chart, input the following code in
the Markers sections, save and go to the frontend.
<marker id="labelSet0">Single curve</marker>
Options
Options are defined in the chart.js documentation. They can be set by
overloading the <data> tag associated with the options
attribute of the chart. For example, in the LineChart.xml template,
the chart is defined as follows:
<lineChart id="1" data="data#lineChartData" options="data#lineChartOptions" >
   ....
</lineChart> The options attribute is a reference to the <data> tag whose id is lineChartOptions.
Overloading this tag in the Data section of the flexform will set options.
Let us assume that the data section is still configure for a single chart, with a modifed label.
Add the following code in the Data section of the flexform. It will cancel the animation,
set a linear interpolation between points.
<data id="lineChartOptions" >
   <item key="animation"></item>
   <item key="elements">
      <item key="line">
         <item key="tension" value="0" />
      </item>
   </item>
</data> Note
A linear interpolation is obtained by setting tension to 0 in
Chart.defaults.global.elements.line
(see chart.js documentation).
Since the global option are in the <data>
whose id is lineChartOptions, nested items whose
keys are elements and line provide acces to Chart.defaults.global.elements.line.
Tip
To generate a boolean value, set the attribute value to true or false.