Extension Overview
Edit the extension sav_library_example9
in the SAV Library Kickstarter to get an overview. It contains
one form with three conventional List, Single and Edit views.
There is nothing special in the List view.
Edit View
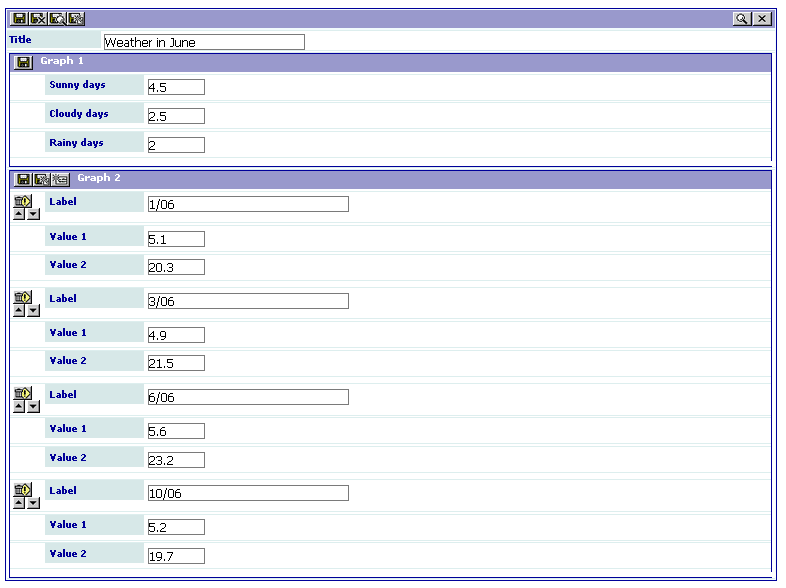
Two subforms are used to input the graph data. Even if another choice was possible
for the field graph1, the use of a subform makes it possible to use similar queries
for the graph.
The subform
graph1is configured to allow the input of one item. It is used to input the number of sunny, cloudy and rainy day in the month.the subform
graph2is used to enter the minimal and maximal temperature for a given day. Note the field attributes used to add a delete button and up and down buttons in front of each item.addDelete = 1; addUpDown = 1;
Single View
The type of the field graph is Graph.
Its configuration includes the following properties.
cutLabel = 1;
graphTemplate = typo3conf/ext/sav_library_example9/Resources/Private/Templates/Charts.xml;
allowQueries = 1;
tags =
   marker#uidQueryGraph1 = 1,
   marker#uidQueryGraph2 = 2,
   marker#uidMainTable = ###uidMainTable###,
;
Analyze the graph template Charts.xml provided in the folder
Resources/Private/Templates of the extension.
The markers marker#uidQueryGraph1 and marker#uidQueryGraph2 are used in the
definition of the query manager. You could have to modify the value 1 and 2 as explained
in the next section. The marker marker#uidMainTable takes the value of the current
uid of the main table, i.e. tx_savlibraryexample9. This value is always available
by means of the marker ###uidMainTable###.
<query id="graph1">
    <setQueryManager name="savcharts" uid="marker#uidQueryGraph1" uidMainTable="marker#uidMainTable" />
</query>
...
<query id="graph2">
    <setQueryManager name="savcharts" uid="marker#uidQueryGraph2" uidMainTable="marker#uidMainTable" />
</query>
Queries
Add two Sav Charts queries in backend list mode. The following caption shows the
result with queries inserted in the Data folder.
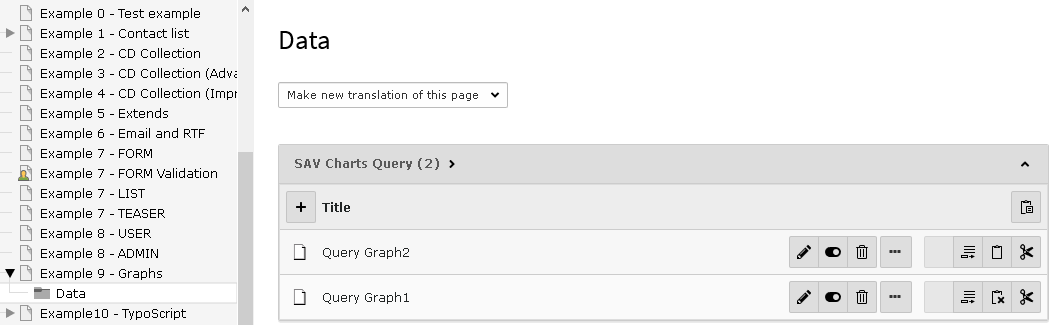
Fill the query Query Graph 1 as shown below.
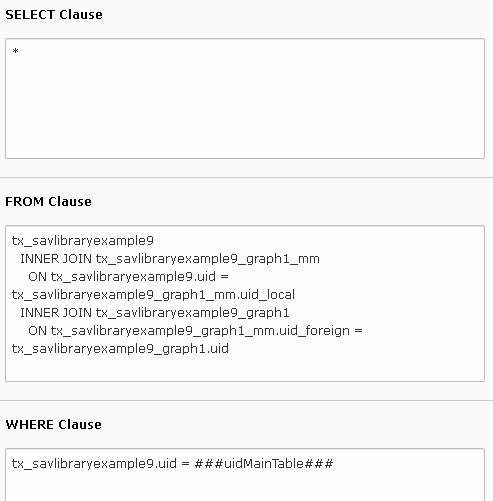
The subforms used for the field graph1 and graph2 generates relations n:n.
Therefoe, the FROM clause joins the tables tx_savlibraryexample9,
tx_savlibraryexample9_graph1_mm and tx_savlibraryexample9_graph1.
tx_savlibraryexample9
INNER JOIN tx_savlibraryexample9_graph1_mm
    ON tx_savlibraryexample9.uid = tx_savlibraryexample9_graph1_mm.uid_local
INNER JOIN tx_savlibraryexample9_graph1
    ON tx_savlibraryexample9_graph1_mm.uid_foreign = tx_savlibraryexample9_graph1.uid
The WHERE clause retricts the records to the one used by the Single view. The marker
###uidMainTable### does the job.
tx_savlibraryexample9.uid = ###uidMainTable###
Fill the query Query Graph 2 by replacing respectively
tx_savlibraryexample9_graph1 and tx_savlibraryexample9_graph1_mm by
tx_savlibraryexample9_graph2 and tx_savlibraryexample9_graph2_mm.
Important
The uid of the Sav Charts queries should be 1 and 2. However, if you do have already enter
other Sav Charts queries their uid will be different. You can modify the values in the
tags property of the field graph in the Singe view and regenerate the extension.
You may also change the configuration using the field
configuration, for example at the
extension level. The following TypoScript sets the values of the
markers marker#uidQueryGraph1 and marker#uidQueryGraph2
respectively to 3 and 4.
plugin.tx_savlibraryexample9_pi1.Default.singleView.fields.graph.tags (
   marker#uidQueryGraph1 = 3,
   marker#uidQueryGraph2 = 4,
   marker#uidMainTable = ###uidMainTable###
)
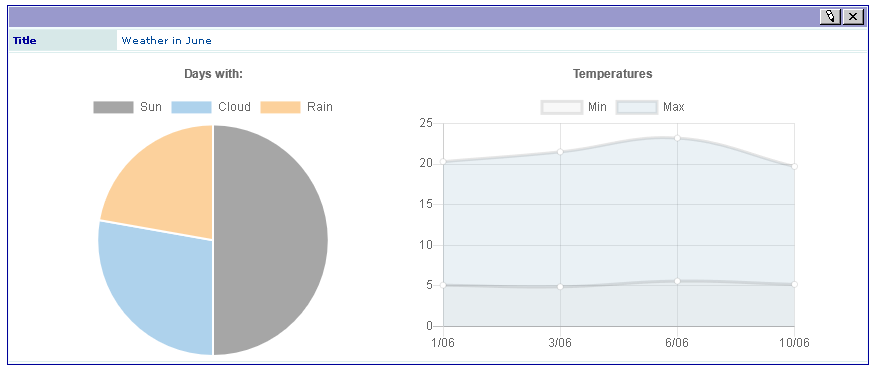
Enter data in the frontend as shown below.
Save, and go to the frontend.