DEPRECATION WARNING
This documentation is not using the current rendering mechanism and is probably outdated. The extension maintainer should switch to the new system. Details on how to use the rendering mechanism can be found here.
EXT: Charts
| Author: | Kasper Skårhøj |
|---|---|
| Created: | 2002-11-01T00:32:00 |
| Changed by: | Arne |
| Changed: | 2009-11-18T12:10:55 |
| Author: | Arne Wagner |
| Email: | arne.wagner.typo3@web.de |
| Info 3: | |
| Info 4: |
EXT: arCharts
Extension Key: ar_charts
Copyright 2009, Arne Wagner, <arne.wagner.typo3@web.de>,
This document is published under the Open Content License
available from http://www.opencontent.org/opl.shtml
The content of this document is related to TYPO3
- a GNU/GPL CMS/Framework available from www.typo3.com
Table of Contents
EXT: arCharts 1
Introduction 1
What does it do? 1
Screenshots 2
Charts created by the extension 2
Users manual 5
General overview 5
Defining chart models 5
Putting a chart onto a page 6
Passing data to the chart 7
A note on the image file names 7
Adminstration 7
Installation 7
Global Configuration Options 8
Permissions 8
File storage & removal 8
Error handling 9
Configuration 9
List of supported chart types 9
Chart type characteristics and requirements 9
Reference: Chart types, properties, and options 10
Reference: Typoscript 14
Reference: Flexform options 15
Reference: Templates 16
Reference: Hooks 16
Error handling / debugging 18
Tutorials 18
Setting up a chart model the easy way 18
Example: pass data via Typoscript 19
Example: call the plugin via Typoscript 20
Example: call & pass data via Typoscript 20
Known problems 22
To-Do list 22
Changelog 22
Introduction
What does it do?
The arCharts extension creates chart graphics of various types, from static or dynamic data. Charts can be adapted to fit the needs through a variety of configuration options (sizes, colors, scaling, axes, labelling, free texts, ...) and come in a look fit for professional use.
The extension uses its own rendering engine. Creation process is fast enough to be done on the fly. Additionally, an internal caching mechanism is used which prevents identical images to be created twice.
For convenient use, handling of the extension is divided in roles of “chart definition” and “chart use”. The first defines chart types, sizes, contents, data source etc. - all the technical stuff; the defined chart can then easily be put onto pages without much ado. Definitions are made through forms rather than through Typoscript, allowing the developer to fast and easily test all configuration options.
The extension tries to combine the most of “vast possibilities”, “ease of use”, “minimum server load” and “maximum security”.
Screenshots
Charts created by the extension
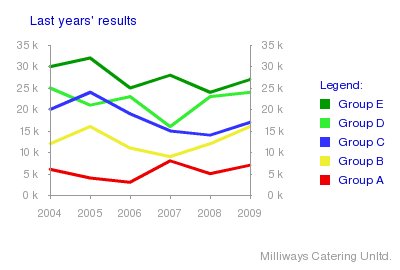
A “Lines” chart:
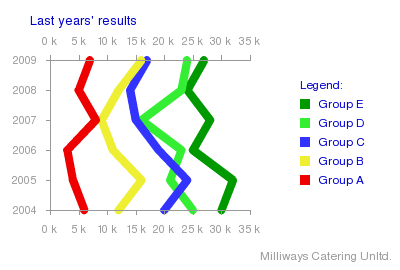
The same chart, but rotated and flipped, and with line thickness increased:
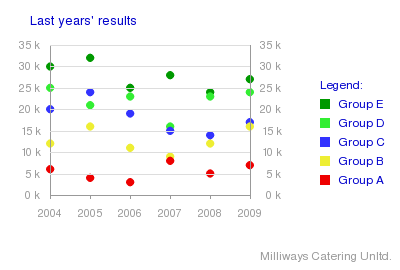 The same data as before, but switched to “points” type and
with a horizontal grid:
The same data as before, but switched to “points” type and
with a horizontal grid:
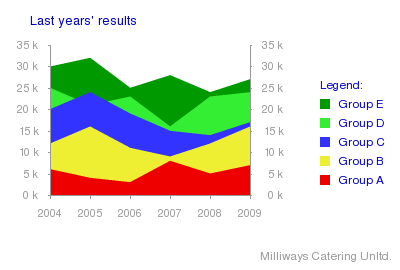
Again the same chart, now switched to “mountains” type:
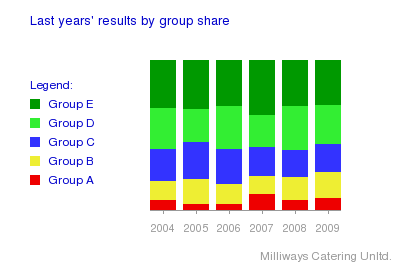
 The same data as “stacked bars row” chart:
 A “Grouped bars” chart:
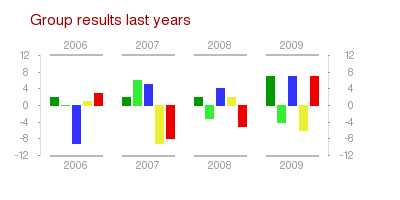
The same data in the same chart, a little modified in the look, and flipped horizontally:
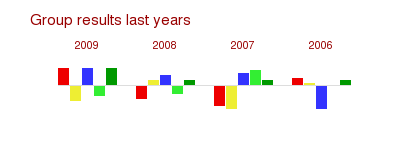 A “parallel bars” chart:
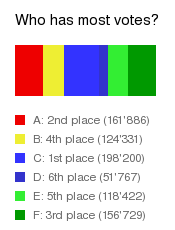
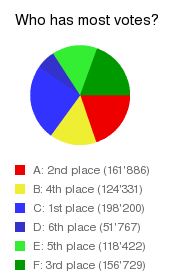
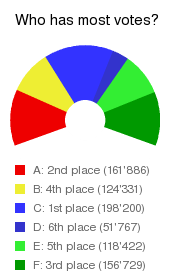
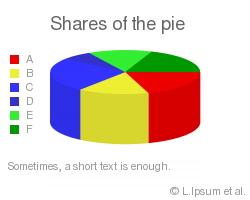
One data as “stacked bar”, “pie 2D”, “parliament” and two versions of “pie 3D” chart:
Users manual
General overview
A configurable chart has quite a few options to decide about: which chart type? Dimensions? Axes? Scaling? Line thickness? Rotation? And so on... Imagine you did all those decisions directly on the page where you want to use the chart. Whenever you want to use a similar chart, you either have to create it anew with all the options, or remember where you used that chart and copy it - in very short time there will be quite a chaos.
That's one of the reasons arCharts separates into "chart definition" and "chart use". Charts are defined in one place, they get a name and possibly a short description, then stored as "chart models" into Sysfolders. When you want to use a chart, you select one from the defined chart models, and you're done in a moment.
Aside from preventing chaos and allowing fast use on the page, this two-step approach allows a role division: all the technical and details stuff in one hand, decisions about page content in the other.
Actually, there is a third step - but it is mostly invisible. The administrator can restrict certain selections to acceptable options, and can set an overall limit to the image size. By default, no such limitation is set;. For details, see "Administration -> Global Configuration Options".
Defining chart models
As explained in the section before, you need a chart model to be able to use a chart on a page. The chart model can be seen as the form where tha actual data is put into, and which defines how the data is displayed.
Chart models are defined through a form that shows up when you create a new record of "Chart model" type.
Typically, you would set up a sysfolder to store the models (you need a place to store the models in). In the sysfolder, switch to "List" module, click on "Create new Record" and choose "Chart model" as record type: a form will show up, in which all configuration can be done.
The form shows a number of tabs, which organize the many configuration options. All options are explained in “Reference: Chart types, properties, and options”; but most of them are self-explaining.
A good way to go through the tabs is:
Start in the “General” tab by giving the chart model a name - it's required, you can't store the model without it.
Next click on the “Dimensions” tab: how big should the image be, how big the chart in the image, and where should the chart be placed on the image?
the “Data source” tab: which data sources should be allowed?
in the “Paths” tab, defaults should be OK for the beginning.
in the “Free texts” tab, you can enter up to five texts to be positioned anywhere on the image.
Now the interesting part starts: in the “Chart type” tab, choose a chart type. The form will reload, and the chart specific options will be presented.
In the “Chart Extras” tab, you can decide on extras like rotation, flip, axes (which include scaling), zero line and global label group. Which options are shown depends on the chart type - for example, an axis wouldn't make sense for a pie chart, so this option is not visible.
Depending on your choices in the “Chart Extras” tab, other tabs become visible, allowing configuration of the extras you chose.
An easy, intuitive way to set up a chart model is described in “Tutorials -> Setting up a chart model the easy way”. If you want to have the details on what you can configure, have a look at "Configuration -> Reference: Chart types, properties, and options".
Tip: when the number of chart models grows, you can put the models into different sysfolders to achieve better overview. When selecting a chart model to put a chart onto a page, the user can limit the list of shown models so that only models from certain folders are listed.
Putting a chart onto a page
First of all, if you want a chart, you need at least one chart model ready for use. If you don't have that, a look at the previous sections "General overview" and "Defining chart models" might be useful.
There are two ways to get a chart onto a page. The standard way is creating a new “page content” record; the other way calling the plugin by Typoscript.
Calling the plugin by Typoscript needs some developer knowledge. Please refer to “Configuration -> Reference: Typoscript”, or have a look at “Tutorials -> Example: call the plugin via Typoscript” for details.
The standard way, however, is easy.
When you clock “create new record”, choose the “Chart” type from the list of selectable record types. It might be at the bottom of the list. In the form that shows up, click the “plugin” tab. All the following inputs are located in that tab.
Go top to bottom through the inputs that are shown:
With the “Data Input Type ” selector, choose between passing data dynamically to the plugin or entering manually (“direct input”). After that selection is done, the form reloads.
Select a model. When you do, and when the person who defined the chart model took the time, the “internal infotext” field will show information related to the selected model.The “Chart model” select is filled with all models that allow the chosen data input type. If the list is too long, you can narrow the selection with the “Chart Model Folders” input. Select one or more sysfolders, save the form, and only models that are stored in the selected folders show up in the list.
If you chose “dynamic data” as data input type, select the data source. It can be “typoscript” or “PHP Hook” depending on the model. Of course, using one of these needs an appropriate data source set up to make it work; see next chapter, "Passing data to the chart".
Optional: choose a file format - PNG is default and typically has the best look. Depending on the file format, an input “JPG Quality” of “PNG compression” may show up - their default values are quite OK, change them if you want. You can change again later, if you want (as almost everything).
Optional: choose a background color - white is default
Optional: if you want to make sure that the chart model you chose always remains the same, set “Store model locally” to “yes”. If set to “no”, updates in the model will reflect directly on the page - which, by the way, is an excellent way to set up a model and test all the options of model definition (using a hidden page)
Disregard the “Restart Image Caching” button for now (see “Configuration -> Reference: Flexform options” for details)
If you chose “direct input” as data input type,you have to provide the data. Have a look at the next chapter, "Passing data to the chart".
You see: the jobs that needs some work are “defining a model” and “setting up the data source”. Just putting the chart on the page is the easy one.
Passing data to the chart
Direct input
If no data source is prepared, the easiest way of getting data into a chart is choosing a model that allows “direct input” as data source, to directly enter values, colors, and labels manually.
If “Direct Input” is chosen (in the flexform that shows up after “create new content” and so on), a selectbox allows to define the number of datasets you want to enter. After that, for each dataset a set of fields named “values”, “color”, and “label” will be ready to take your input Depending on the chart type, two fields named “Index Labels” and “Index Labels Divider” might show up, too.
To fill the fields with what the chart type needs, you should have a look at "Configuration -> Chart type characteristics and requirements" and "Configuration -> Reference: Flexform options" . There are only very few restrictions you have to know about - but not knowing them might bring annoying situations.
Typoscript
Please refer to "Reference: Typoscript -> Passing data to the plugin", or have a look at “Tutorials -> Example: pass data via Typoscript”.
Hook
Please refer to "Reference: Hooks -> setData Hook".
A note on the image file names
The image file names look a bit ugly. They consist of a prefix (“chart_” is the default), followed by a long random-looking string. This is due to the internal caching mechanism that prevents an already existing image to be created a second time (thus speeding things up). The file names are made up from a hash that is unique for the very information displayed in the image: if you change one parameter, the image will get a new file name.
If you need a human readable file name, consider using “Store Copy As”, which creates a copy of the chart under a name that is free to choose - see "Reference: Chart types, properties, and options -> Chart Model Parameters ->Paths->Store Copy As" for details.
Adminstration
Installation
Install the extension via Extension Manager.
Extension Manager will ask to create two tables in the database, and to create the folder “uploads/tx_archarts/”; confirm.
Extension Manager will show global configuration options for the extension (see “Global Configuration Options” below); change them or leave them as they are, and click “make updates”.
That's all - now you can start creating charts (see “User manual” below).
Global Configuration Options
Note - for better understanding of the options mentioned here, you might want to read the first paragraph of the “Users manual” chapter, “General overview”, which describes the overall data organization.
Global configuration options enable the server administrator to disallow certain configuration options.
During installation, they show up automatically ; later, they are reached in Extension manager by a click on the extension name.
The options are:
- Acceptable Data Sources - defines which data sources can be selected for model definition. Value must be set to a comma-separated list consisting of one or more from typoscript - data is given by from typoscript phpHook - data is given by PHP hook directInput - data is entered manuallyAs default, all of these sources are allowed.
- Acceptable Chart Types - defines which chart types may be used. Value must be set to a comma-separated list consisting of one or more from pie2d, pie3d, parliament, lines, mountains, points, parallelBars, groupedBars, stackedBar, stackedBarsRow .As default, all of these values are allowed.
- Acceptable File Formats - defines which file formats may be used. Value must be set to a comma-separated list consisting of one or more from png, jpg, gif.As default, all of these values are allowed.
- Maximum Image Area - defines up to how many pixels an image may contain (width * height), both during creation and in final image. If the adminstrator wants to set an overall limit to protect the server (or to avoid a PHP error message because it tried allocating too much memory), this is the place to do it. If not set, or set to zero, no limit is in effect.As default, the value is set to “0”, so no limit is in effect.
Permissions
The only built-in permission issues outside the global configuration options (see above) regard the storage of the image files.
The file name under which the chart images are stored consists of
- a prefix defined in the model,
- a hash made from all parameters used for image creation,
- and the file extension, depending on the file format chosen.
The file is stored in a folder that is defined in the model.
Both “Charts File Prefix” and “Charts Storage Folder” are Typo3 “Exclude Fields”, which only an admin user can change.
The values default to “chart_” and “uploads/tx_archarts/”.
File storage & removal
Chart images are stored in a Charts Storage Folder that is defined within the chart model.
The file name is made from a prefix defined in the model, then a md5-hash of the image content, and the file extension according the the file format defined on the page (flexform or typoscript).
Over the time, a lot of images might be created. For the moment, the extension doesn't care of your server's disk space; so you might want to set up a cronjob to remove old files.
Error handling
When an error occurs that prevents the script from further work, the internal error message is written to the Typo3 syslog, the plugin does no further processing, and a replacement image or nothing is shown where the chart should be.
Standard error handling can be overridden by hook; see “Configuration -> Hooks -> internalError Hook” for details.
Be sure to turn the syslog on (in install tool), if you want to make use of this feature.
Configuration
List of supported chart types
Currently, these chart types are supported:
- Pie Types: Pie 2D, Pie 3D, Parliament
- Line Types: Lines, Points, Mountains
- Bar types: Parallel Bars, Grouped Bars, Stacked Bar, Stacked Bars Row
Chart type characteristics and requirements
There are some characteristics which are shared by groups of chart types. These characteristics determine some of the options which are available for the charts.
“Single index” vs. “Multi index”
There are chart types that display one value per dataset, and there are chart types whose datasets consist of multiple (at least two) values. The first we'll call “single index” types, the latter “multi index” types - based on how many index labels a dataset needs. For the “single index” types, there is only one value and one label for each dataset. For the “multi index” types, there is 1.) the labels of the datasets -e.g. “Series A”, “Series B”- and 2.) a row of labels for the values - e.g. “2001”,”2004”,”2007”.
“ Multi index” types are:
- lines types (lines, points, mountains)
- stacked bars row, grouped bars
“ Multi index” types requirements:
- must have at least two single values per dataset
- must have the same number of single values in each dataset
- must have extra “index labels” provided, if index axis labels or global labelgroup is to be displayed - with the count of index labels matching the count of single values.
“ Single index” types are:
- pie types (pie 2D, pie 3D, parliament)
- stacked bar, parallel bars
“ Single index” types requirements:
- must have one single value in each dataset
- do not need extra index labels
“Non negative”
For obvious reasons, the following chart types can not display negative values:
- pie types (pie 2D, pie 3D, parliament)
- stacked bar
- stacked bars row
Reference: Chart types, properties, and options
Note: if this reference helps you somehow - great; but you don't really have to read this if you just want to set up a chart model. Most options do what you'd expect them to do. Have a look at “Tutorials -> Setting up a chart model the easy way” for - well, an easy, intuitive way to set up a chart model.
The reference list contains all parameters available when defining a chart model. It is ordered following the tabs where the options appear.
Tabs
The following tabs are always visible when defining a chart model:
- General: set a name for the model, and possibly an internal infotext, and its start- and end time stop. Obvious configuration errors are displayed here, too.
- Chart Type: define the chart type, and the options directly related to the type.
- Chart Extras: decide about the extras: rotation, flip, and whether to show zero line, axes, and/or a global label group.
- Dimensions: the overall size of the image, the size of the chart itself, and the margins between chart and image border
- Data Source: here you decide which the data input is appropriate for the model: direct input, typoscript, or PHP hook.
- Paths: where the system finds needed files, where to store the chart, whether to store a copy of the image under a different name
- Free Texts: be it header, footer, additional information - up to 5 texts can be defined and placed somewhere on the image
The following tabs are only visible if in the "Chart Extras" tab you chose to use the options they configure, and if the chart type supports them:
- Zero Line : a line drawn on "zero value" height, parallel to the index axis.
- Value Axis : the axis on which the values are shown - the “y-axis” in a standard chart.
- V-Axis Tickmarks : small marks visualizing value steps
- V-Axis Tickmarks Labels : labels for the tickmarks
- Index Axis : the axis on which either (for “parallel bars” chart type) the different datasets are placed in parallel, or along which the different states of a dataset go. The “x-axis” in a standard chart.
- I-Axis Tickmarks : small marks visualizing index steps
- I-Axis Tickmarks Labels : labels for the tickmarks
- Global Labelgroup : a group of color/label pairs that is placed independently from the chart axes.
Chart Model Parameters
Errors
Property
Errors
Availibility
Description
not editable . Shows obvious errors in configuration, e.g. if image size is zero.
Chart Model Name
Property
Chart Model Name
Availibility
Description
internal identifier for the model. Is used when a model is chosen for putting onto the page.
Internal Infotext
Property
Internal Infotext
Availibility
Description
internal info about the model, e.g. intended use. Not shown publicly.
Starttime
Property
Starttime
Availibility
Description
Typo3 standard: if given, the model cannot be used before this date
Endtime
Property
Endtime
Availibility
Description
Typo3 standard: if given, the model cannot be used after this date
Chart Type
Property
Chart Type
Availibility
Description
selects the chart type; see "List of supported chart types" above.
(Outer) Diameter
Property
(Outer) Diameter
Availibility
only for pie types
Description
diameter of the pie. If chart type is "parliament", this is the outer diameter.
Inner Diameter
Property
Inner Diameter
Availibility
only for "parliament" type
Description
inner diameter.
Start Degree
Property
Start Degree
Availibility
only for pie types
Description
in which angle to start drawing, given in degree. 0 means "towards east", 90 means "toward south" and so on.
End Degree
Property
End Degree
Availibility
only for "parliament" type
Description
in which angle to end drawing, given in degree. 0 means "towards east", 90 means "toward south" and so on.
Bar Width
Property
Bar Width
Availibility
only for bar types
Description
width of the bar(s)
Distance between Bars
Property
Distance between Bars
Availibility
only for bar types, except "stacked bar"
Description
space between bars
Distance between Bar Groups
Property
Distance between Bar Groups
Availibility
only for "grouped bars" type
Description
space between bar groups
Line Thickness
Property
Line Thickness
Availibility
only for "lines" and "points" types
Description
thickness of the lines, resp. diameter of the points
3D Distortion
Property
3D Distortion
Availibility
only for "pie 3D" type
Description
how much the pie is "laid back"; technically, the pie diameter pixels divided by the pie height pixels
Edge Height
Property
Edge Height
Availibility
only for "pie 3D" type
Description
height of the edge
Edge Color Ratio
Property
Edge Color Ratio
Availibility
only for "pie 3D" type
Description
how much brightness the edge has, compared to the slice colors
Chart Orientation
Property
Chart Orientation
Availibility
not for pie types
Description
whether/how the chart is rotated
Chart Flip
Property
Chart Flip
Availibility
not for pie types
Description
whether/how the chart is flipped
Show Zeroline
Property
Show Zeroline
Availibility
only for line, "parallel bars", and "grouped bars" types
Description
whether a line is drawn on "zero value" height. Configure in separate tab.
Display Value Axis
Property
Display Value Axis
Availibility
not for pie types
Description
whether the value axis is used, and whether marks or labelled marks are shown. Using the value axis activates scaling, even if the axis is made invisible. Configure in separate tab.
Display Index Axis
Property
Display Index Axis
Availibility
not for pie types
Description
whether the index axis is used, and whether marks or labelled marks are shown. Configure in separate tab.
Display Global Label Group
Property
Display Global Label Group
Availibility
Description
whether a seperate group of colors with their labels is shown. Configure in separate tab.
Image Width
Property
Image Width
Availibility
Description
overall width of the image
Image Height
Property
Image Height
Availibility
Description
overall height of the image
Chart Width
Property
Chart Width
Availibility
Description
width of the chart itself
Chart Height
Property
Chart Height
Availibility
Description
height of the chart itself
Chart Position: Left Margin
Property
Chart Position: Left Margin
Availibility
Description
left margin from chart area to image border
Chart Position: Top Margin
Property
Chart Position: Top Margin
Availibility
Description
top margin from chart area to image border
Creation Size Ratio
Property
Creation Size Ratio
Availibility
not for bar types
Description
when circles, arcs, or non-orthogonal lines are drawn, image quality is improved dramatically if the image is created bigger then needed, and resized afterwards. this value determines how much bigger the image is during creation. Due to a flaw in PHP's image resizing, it is advised to use integers only (3 is a good standard choice), as blurs might appear otherwise.
Data Source
Property
Data Source
Availibility
Description
where the data can be taken from. If you select more than one data source, the final choice is done when the model is put on the page.
Data variable name
Property
Data variable name
Availibility
not if Data Source is “direct input”
Description
the name of the array that holds the datasets and index labels (if any) variables
Template Fle
Property
Template Fle
Availibility
Description
path to the file holding the HTML templates
Path to Replacement Image
Property
Path to Replacement Image
Availibility
Description
path to an image that is shown if the chart image cannot be shown, e.g. in case of error. Prevents an ugly "broken image" symbol from showing up. Default is "blank.gif".
Font File
Property
Font File
Availibility
Description
path to font file used for texts in the image.
Charts Storage Folder
Property
Charts Storage Folder
Availibility
Description
folder where the chart images are stored. This is an "exclude field", which means that you have to have admin rights to change it. Default is "uploads/tx_archarts".
Charts File Prefix
Property
Charts File Prefix
Availibility
Description
Prefix to file name. This is an "exclude field", which means that you have to have admin rights to change it. Default is "chart_".
Store Copy As
Property
Store Copy As
Availibility
Description
if set, a copy of the chart is stored under this name every time the chart is created. Good for situations where you want a chart that changes over time to be displayed under a stable file name. You must include the path, but NOT the file extension - file extension is determined by file format, and that is decided by the user of the charts (within the limits of global configuration, see "Global Restrictions"). A good example would be "fileadmin/tx_archarts/current_market" (which leads to an image “current_market.png”, if File Format is set to “png”).
***Note: this section is only available if activated in “Chart
Property
*Note: this section is only available if activated in “Chart Extras”.*
Zero Line Width
Property
Zero Line Width
Availibility
Description
width of the zero line
Zero Line Color
Property
Zero Line Color
Availibility
Description
color of the zero line
***Note: this section is only available if activated in “Chart
Property
*Note: this section is only available if activated in “Chart Extras”.*
***Note: All side names apply to the non-rotated, non-flipped chart. X
Property
*Note: All side names apply to the non-rotated, non-flipped chart. X and y positions apply to left side axis; if the value axis is shown on another side, all x and y values are adapted symmetrically.*
Side of Value-Axis
Property
Side of Value-Axis
Availibility
Description
select on which side(s) of the chart the value axis is shown: left (default), right, both, or none. If set to "none", axis, tickmarks, and tickmark labels are not shown, but scaling rules are still in effect; set "axis_v_display" to none to disable scaling.
Value-Axis: Start X
Property
Value-Axis: Start X
Availibility
Description
left start position of value axis, seen relative from chart area. Negative values move the axis to the left, positive to the right.
Value-Axis: Start Y
Property
Value-Axis: Start Y
Availibility
Description
top start position of value axis, seen relative from chart area. Negative values lets move the axis start position upwards, positive downwards. The length of the axis is adapted automatically, so that start and end positions are always symmetrical.
Value-Axis: Minimum Value
Property
Value-Axis: Minimum Value
Availibility
Description
Minimum value of the axis. Used for scaling and, if used, for tickmark labelling.
Value-Axis: Maximum Value
Property
Value-Axis: Maximum Value
Availibility
Description
Maximum value of the axis. Used for scaling and, if used, for tickmark labelling. Must be bigger as minimum value.
Value-Axis: Line Width
Property
Value-Axis: Line Width
Availibility
Description
color of the value axis.
Value-Axis: Color
Property
Value-Axis: Color
Availibility
Description
width of the value axis.
***Note: this section is only available if activated in “Chart
Property
*Note: this section is only available if activated in “Chart Extras”.*
Value-Axis Tickmarks: Step Value
Property
Value-Axis Tickmarks: Step Value
Availibility
Description
determines the frequency in which tickmarks are shown. Its meaning depends on "step type", see next entry.
Value-Axis Tickmarks: Step Type
Property
Value-Axis Tickmarks: Step Type
Availibility
Description
Unit for "step value", see previous entry. Can be "pixels" (so each {step} pixels a tickmark is shown) or "value" (so everytime the value increases by {step}, a tickmark is shown). First tickmark is drawn at axis start, last is drawn on last step before axis end.
Value-Axis Tickmarks: Direction
Property
Value-Axis Tickmarks: Direction
Availibility
Description
the direction in which to draw the tickmarks: "inwards" is towards the chart center, "outwards" is towards the image border.
Value-Axis Tickmarks: Start Positiont
Property
Value-Axis Tickmarks: Start Positiont
Availibility
Description
where to start drawing the tickmark. if direction is "inwards", positive values move the start position towards the chart center, if "outwards", positive values move the start position towards the image border. Negative values do the opposite.
Value-Axis Tickmarks: Length
Property
Value-Axis Tickmarks: Length
Availibility
Description
lenght of the tickmarks.
Note: with “inwards” direction and a high “lenght” value, you can create a grid laid over the chart.
Value-Axis Tickmarks: Width
Property
Value-Axis Tickmarks: Width
Availibility
Description
width of the tickmarks.
Value-Axis Tickmarks: Color
Property
Value-Axis Tickmarks: Color
Availibility
Description
color of the tickmarks.
***Note: this section is only available if activated in “Chart
Property
*Note: this section is only available if activated in “Chart Extras”.*
Value-Axis Tickmark Label: Format
Property
Value-Axis Tickmark Label: Format
Availibility
Description
the PHP "sprtf" format in which the values are shown. Defaults to %s which means roundabout “simply show as is”
Value-Axis Tickmark Label: Distance to Axis
Property
Value-Axis Tickmark Label: Distance to Axis
Availibility
Description
distance between axis and labels. Positive values move the labels towards the image border
Value-Axis Tickmark Label: Font Size
Property
Value-Axis Tickmark Label: Font Size
Availibility
Description
font size of the labels
Value-Axis Tickmark Label: Color
Property
Value-Axis Tickmark Label: Color
Availibility
Description
color of the labels
All options are the same as for value axis, with one exception:steps /
Property
All options are the same as for value axis, with one exception:steps / steptypes are bound to the positions of the datasets resp. bars (depending on chart type), so this two options are not available.
All options are the same as for value axis, with one exception:instead
Property
All options are the same as for value axis, with one exception:instead of values the index labels (or, for the "parallel bars" chart type, the "label" array members) are shown.
***Note: this section is only available if activated in “Chart
Property
*Note: this section is only available if activated in “Chart Extras”.*
Global Label Group: X-Position
Property
Global Label Group: X-Position
Availibility
Description
left start position of the global label group, seen from the left border of the image
Global Label Group: Y-Position
Property
Global Label Group: Y-Position
Availibility
Description
top start position of the global label group, seen from the top border of the image
Global Label Group: Text
Property
Global Label Group: Text
Availibility
Description
text that prepends the color label lines
Global Label Group: Font Size
Property
Global Label Group: Font Size
Availibility
Description
font size of the global label group
Global Label Group: Color
Property
Global Label Group: Color
Availibility
Description
color of the global label group
***Note: this section is only available if activated in “Chart
Property
*Note: this section is only available if activated in “Chart Extras”.*
Count of Free Texts
Property
Count of Free Texts
Availibility
Description
count of free texts that shall be displayed
Free Text {number}: X-Position
Property
Free Text {number}: X-Position
Availibility
Description
left start position of the text, seen from the left border of the image
Free Text {number}: Y-Position
Property
Free Text {number}: Y-Position
Availibility
Description
top start position of the text, seen from the top border of the image
Free Text {number}: Text
Property
Free Text {number}: Text
Availibility
Description
the text that is writeen onto the image
Free Text {number}: Font Size
Property
Free Text {number}: Font Size
Availibility
Description
font size of the text
Free Text {number}: Colorr
Property
Free Text {number}: Colorr
Availibility
Description
color of the text
Reference: Typoscript
Calling the plugin
When calling the plugin by Typoscript, all of these Typoscript properties are required. All of these values must be given as plain strings.
modelId
Property
modelId
Data type
integer
Description
Uid of the chart model
dataSource
Property
dataSource
Data type
string
Description
must be set to either “typoscript” or “phpHook ”
fileFormat
Property
fileFormat
Data type
string
Description
must be set to any of “png”, “jpg”, or “gif”
pngCompression
Property
pngCompression
Data type
integer
Description
if File Format is set to “png”, this determines the PNG Image Compression: from 0 (best quality) to 9 (smallest file). 0 is a standard choice.
jpgQuality
Property
jpgQuality
Data type
integer
Description
if File Format is set to “jpg”, this determines the JPG Image Quality: from 0 (smallest file) to 100 (best quality). 90 would be a standard choice.
backgroundColor
Property
backgroundColor
Data type
integer | string
Description
must be set to a 6-digit hex rgb color. May be preceded by a “#” (optional)
Passing data to the plugin
When passing data to the plugin by Typoscript, all of these Typoscript properties must be given. All of these properties must be given as Typoscript objects, such as TEXT or COA.
When only passing data by typoscript, the data variable must reside in plugin.tx_ar_charts_pi1. When passing data and at the same time calling the plugin by Typoscript, the data variable must reside parallel to "userFunc". For “data variable” explanation, see 2nd note below.
***Note: always replace “{i}” with the current dataset index, for as
Property
*Note: always replace “{i}” with the current dataset index, for as many datasets as you want.*
***Note: the property “data” mentioned in this list only exists as a
Property
*Note: the property “data” mentioned in this list only exists as a default. When defining a model, you define which name this property has (or, said differently, which typoscript-defined array to use for data input). Instead of “data.datasets / data.indexLabels / data.indexLabelsDivider”, it can be “data2.datasets / data2.indexLabels / data2.indexLabelsDivider” when the model is defined differently. See “"Reference: Chart types, properties, and options -> Chart Model Parameters -> Data Source -> Data variable name” for details.*
data.datasets.{i}.value
Property
data.datasets.{i}.value
Data type
integer | string
Description
value of dataset {i}. For “simple index” chart types, the value has to be numeric. For “multi index” types, the values per dataset are put into a comma-seperated list.
data.datasets.{i}.label
Property
data.datasets.{i}.label
Data type
string
Description
label of dataset {i}
data.datasets.{i}.color
Property
data.datasets.{i}.color
Data type
integer | string
Description
color of dataset {i}
data.indexLabels
Property
data.indexLabels
Data type
string
Description
For “multi index” chart types, this property must be set to the index labels for the single values. The separator used between the single labels is defined by indexLabelsDivider, see below
data.indexLabelsDivider
Property
data.indexLabelsDivider
Data type
string
Description
separator used between the single labels of indexLabels
Have a look at "Tutorials -> Example: pass data via Typoscript" for copy&paste code.
Reference: Flexform options
Data Input Type
Property
Data Input Type
Data type
(select)
Description
whether to give data dynamically (typoscript or hook) or per direct input (manually). Influences the list from which to select the model.
Chart Model
Property
Chart Model
Data type
(select)
Description
sets the chart model to use
Chart Model Folders
Property
Chart Model Folders
Data type
(group select)
Description
this select allows the reduction of the offered models' list. If a selection is done here, only models that are stored in the selected sysfolders are shown in the “chart model” select.You have to store the flexform before this limitation takes effect.
Internal Infotext
Property
Internal Infotext
Data type
Description
not editable. Displays the infotext that was stored with the model. Is not displayed in frontend.
Data Source
Property
Data Source
Data type
(select)
Description
sets the data source to use. Selction is limited to the data sources that are allowed for this model in the model definition
File Format
Property
File Format
Data type
string
Description
whether the image should be created as “png”, “jpg”, or “gif”. Selection is limited to the file formats allowed in global configuration.
PNG Compression
Property
PNG Compression
Data type
integer
Description
if File Format is set to “png”, this determines the PNG Image Compression: from 0 (best quality) to 9 (smallest file). 0 is a standard choice.
JPG Quality
Property
JPG Quality
Data type
integer
Description
if File Format is set to “jpg”, this determines the JPG Image Quality: from 0 (smallest file) to 100 (best quality). 90 would be a standard choice.
Background Color
Property
Background Color
Data type
integer | string
Description
must be set to a 6-digit hex rgb color. May be preceded by a “#” (optional)
Store Model Locally
Property
Store Model Locally
Data type
(select)
Description
if set to “yes”, the currently selected model is stored with the plugin. This implies that changes in the model do not affect any more the output of the plugin.If the model is currently stored with the plugin, and “Store Model Locally ” is set to “no”, the stored model is discarded, and the plugin tries to retrieve the model from its normal table again, with all changes that may have been made to it.
Restart Imgae Caching
Property
Restart Imgae Caching
Data type
(button)
Description
Quite likely you'll never need this button. But if for whatever reason an erroneus image has been internally cached, hitting this button pretends that the image has changed, and so starts internal caching anew. Note that this has no effect whatsoever on normal Typo3 caching - if you changed the TS template, this button is no substitute for the normal Typo3 “Clear caches” button.
***Note: the following inputs are only available if data source is set
Property
*Note: the following inputs are only available if data source is set to “direct input”:*
indexLabels
Property
indexLabels
Data type
Description
For “multi index” chart types, this property must be set to the index labels for the single values. The separator used between the single labels is defined by indexLabelsDivider, see below
indexLabelsDivider
Property
indexLabelsDivider
Data type
Description
separator used between the single labels of indexLabels
Count of Datasets
Property
Count of Datasets
Data type
Description
sets count of datasets
values
Property
values
Data type
Description
value of the dataset. For “simple index” chart types, the value has to be numeric. For “multi index” types, the values per dataset are put into a comma-seperated list.
label
Property
label
Data type
Description
label of the dataset
color
Property
color
Data type
Description
color of the dataset
Reference: Templates
The following two templates are used:
- ###TPL_CHART### This template is used to wrap the chart image.There is one marker that can be used: ###HREF_CHART_IMAGE### - gets replaced by path to the chartBy default, this template just wraps the image source in an img-tag, and adds “chart” as alt text.
- ###TPL_ERROR### This template is used when an internal error occurs.There are two markers that can be used:- ###MESSAGE_TEXT### - gets replaced with the localized content of “internalError” as defined in pi1/locallang.xml- ###BLANK_IMAGE_SRC### - gets replaced by the path to the replacement image as defined in the modelBy default, this template is empty, so neither image nor error message is shown on the page.
The template file that is used is defined per model. By default, pi1/templates.html is used as the file from where to take the templates. If you customize its content, consider moving the file out of the extension folder, as updates will otherwise overwrite your customized file.
Reference: Hooks
There are two hooks built into the extension: one hook to set data by PHP, and one hook to customize error handling.
setData Hook
This hook is meant to set data from the outside.
The hook must be registered in its extension's ext_localconf.php as
$TYPO3_CONF_VARS[ 'EXTCONF' ][ 'ar_charts' ][ 'setData' ][] = 'user_example_hooks->setArchartsData';
In this example code, “user_example_hooks” is the hook's extension name, and “ setArchartsData” is taken as the name of the hook class method; change it to your needs.
The method will be given two parameters: an empty array (not good for anything, exists for formal reasons only), and a reference to the tx_archarts_pi1 object.
The hook class must call the calling object's setContentDataFromPhp() method with three parameters: datasets, indexLabels, and indexLabelsDivider.
a) for “single index” chart types (see "Chart type characteristics and requirements" for explanation of that term):
$datasets holds the data that will be displayed as chart. Its format is
$datasets = array(
  0 => array(
    'values' => 10 // numeric value
    'color' => '#ff0000' // hex RGB color
    'label' => 'Value A' // string
  ),
  1 => array(
    'values' => 20 // numeric value
    'color' => '#ffff00' // hex RGB color
    'label' => 'Value B' // string
  ),
  2 => ...
  ...
);
Each member of the datasets array must contain one 'values', one 'color' and one 'label' member.
$indexLabels and $indexLabelsDivider can be omitted.
b) for “multi index” chart types (see "Chart type characteristics and requirements" for explanation of that term):
$datasets holds the data that will be displayed as chart. Its format is
$datasets = array(
  0 => array(
    'values' => 10, 20, 40 // string containing comma-separated numeric values (at least 2)
    'color' => '#ff0000' // hex RGB color
    'label' => 'Value A' // string
  ),
  1 => array(
    'values' => '20, 10, 35' // string containing comma-separated numeric values (at least 2)
    'color' => '#ffff00' // hex RGB color
    'label' => 'Value B' // string
  ),
  2 => ...
  ...
);
Each member of the datasets array must contain one 'values', one 'color' and one 'label' member.
$indexLabels is a string that holds the index labels per value. The divider used between the labels is defined by the contents of the third parameter, $indexLabelsDivider.
So, as an example,
$indexLabels = '2001,2004,2007';
$indexLabelsDivider = ',';
results in index labels 2001, 2004, 2007; the same result can be had with
$indexLabels = '2001-2004-2007';
$indexLabelsDivider = '-';
There must be the same number of index labels as of values per 'values' member.
To take the example from above again, the class would look something like
class user_example_hooks
{
  public function setArchartsData( $parameters=array(), &$callingExtObject )
  {
    $datasets = array( ... );
    $indexLabels = '2001-2004-2007';
    $indexLabelsDivider = '-';

    $callingExtObject->setContentDataFromPhp( $datasets, $indexLabels, $indexLabelsDivider );
  }
}
internalError Hook
This hook is meant to change error handling from the outside.
The hook must be registered in its extension's ext_localconf.php as
$TYPO3_CONF_VARS[ 'EXTCONF' ][ 'ar_charts' ][ 'internalError' ][] = 'user_example_hooks->showErrorMessage';
In this example code, “user_example_hooks” is the hook's extension name, and “ showErrorMessage” is taken as the name of the hook class method; change it to your needs.
The “internal error” hook is called with two parameters: a reference to an array, and a reference to the tx_archarts_pi1 object.
The array is holding six members:
$parameters = array(
  'errorMesssage' => $msg,
  'doNotLog' => false,
  'unsetErrorState' => false,
  'chartParams' => $this->chartParams,
  'dataContent' => $this->dataContent,
  'chartVars' => $this->chartVars,
);
'errorMesssage' contains the internal error message that will be logged. Good for case decisions and alternative logging / error alert methods.
- 'doNotLog' is a flag which prevents the error from being logged, if set to true. If you don't want the syslog to be used, take this.
- 'unsetErrorState' is a flag that tells the extension class that the error has been repaired and processing can go on, if set to true. Handle with care.
- 'chartParams' are the parameters determining the image content
- 'dataContent' holds the datasets (values, labels and colors), indexLabels and IndexLabelsDivider
- 'chartVars' are internal vars used for chart creation
The 'chartVars, 'chartParams', and 'dataContent' parameters can be used to fix errors on the fly (e.g. setting disallowed values to a default).
Error handling / debugging
By default, internal errors result in the error template (see “Templates”) being shown - if you did not customize the templates, this means that simply nothing is displayed where the chart should be.
All errors are logged in the Typo3 syslog by default. To take advantage of this, you have to enable syslog in the Install Tool.
Error handling can be customized by a Hook - see “Reference: Hooks -> internalError Hook” above for details.
Tutorials
Setting up a chart model the easy way
Start setting up a chart model (see "Users manual -> Defining chart models"), up to the point where you are able to store and use it - that is, model name, chart type and data source must be set. Set data source to “typoscript”.
Store the model
Create a hidden page
Put the Chart plugin on that page (see "Users manual -> Putting a chart onto a page"), and in the plugin choose the model you started to create
Set up some fake data, e.g. by copy/paste of the example data given in this manual (see "Tutorials -> Example: pass data via Typoscript")
Go back to the model definition and continue.
Let Typo3 show you a preview of the hidden page
Each change in the model will reflect directly in the preview, so hit reload fat the preview page whenever you want to see what a change in the model definition did
Play around with model and fake data until you're OK with the result
Keep the model, discard the hidden page
Example: pass data via Typoscript
Note: if you want to set data via Typoscript AND call the plugin via Typoscript, please refer to "Example: call the plugin and pass data via Typoscript and not to this chapter.
For “single index” chart types (see "Configuration -> Chart type characteristics and requirements" for explanation of the term), copy this snippet into the TS-setup of the page's template:
plugin.tx_ar_charts_pi1 {
  chart {
    datasets{
      0 {
        values = TEXT
        values.value = 10
        label = TEXT
        label.value = Series A
        color = TEXT
        color.value = #ffcc00
      }
      1 {
        values = TEXT
        values.value = 10
        label = COA
        label {
          10 = TEXT
          10.value = that's a typo
          20 = TEXT
          20.value = script COA
        }
        color = TEXT
        color.value = #00ccff
      }
    }
  }
}
For “multi index” chart types (see "Configuration -> Chart type characteristics and requirements" for explanation of the term), copy this snippet into the TS-setup of the page's template:
plugin.tx_ar_charts_pi1 {
  chart {
    datasets{
      0 {
        values = TEXT
        values.value = 10, 20, 30
        label = TEXT
        label.value = Serie A
        color = TEXT
        color.value = #ffcc00
      }
      1 {
        values = TEXT
        values.value = 5, 40, 25
        label = TEXT
        label.value = Serie B
        color = TEXT
        color.value = #00ccff
      }
    }
    indexLabels = TEXT
    indexLabels.value = 1999|2004|2009

    indexLabelsDivider = TEXT
    indexLabelsDivider.value = |
  }
}
2) In the model, set "data source" to "typoscript" and make sure “Data variable name” is set to “data” (as is default). And, of course, set chart type, dimensions etc.
- Clear caches, and see the data in the chart.
Example: call the plugin via Typoscript
Note: if you want to call the plugin by Typoscript AND set data in Typoscript, please refer to "Example: call & pass data via Typoscript" and not to this chapter.
1) Copy this snippet into the TS-setup of the page's template (replace the “modelId” value with an existing model Id, and the “dataSource” value to a value that is allowed in the model):
userLibs.tx_archarts_pi1 = EXT:ar_charts/pi1/class.tx_archarts_pi1.php
temp.ar_chart{
  userFunc = tx_archarts_pi1->main

  getPath = 0
  absolutePath = 0

  modelId = 1
  dataSource = phpHook
  imageFileFormat = png
  pngCompression = 0
  backgroundColor = #ffffff
}
2) In the code, replace the “modelId” value with an existing model Id, and the “dataSource” value to a value that is allowed in the model.
- Still in the template TS-setup, use something like
page.10 < temp.ar_chart
to copy the plugin output to the place you want. Place this behind the first snippet, else “temp.ar_chart” won't most likely contain anything.
4) In the model, make sure that data source, chart type, dimensions etc. are set.
- Clear caches, and see the chart on the page.
Example: call & pass data via Typoscript
Note: if you want to call the plugin by Typoscript OR set data in Typoscript, please refer to "Example: call the plugin via Typoscript" or "Example: pass data via Typoscript" and not to this chapter.
For “single index” chart types (see "Configuration -> Chart type characteristics and requirements" for explanation of the term), copy this snippet into the TS-setup of the page's template:
userLibs.tx_ar_charts_pi1 =
temp.ar_chart{
  userFunc = tx_archarts_pi1->main

  getPath = 0
  absolutePath = 0

  modelId = 1
  dataSource = typoscript
  imageFileFormat = png
  pngCompression = 0
  backgroundColor = #ffffff


  chart {
    datasets {
      0 {
        values = TEXT
        values.value = 10
        color = TEXT
        color.value = 70a3d8
        label = TEXT
        label.value = Series A
      }
      2 {
        values = TEXT
        values.value = 20
        color = TEXT
        color.value = 98c038
        label = TEXT
        label.value = Series B
      }
    }
  }
}
For “multi index” chart types (see "Configuration -> Chart type characteristics and requirements" for explanation of the term), copy this snippet into the TS-setup of the page's template:
userLibs.tx_ar_charts_pi1 =
temp.ar_chart{
  userFunc = tx_archarts_pi1->main

  getPath = 0
  absolutePath = 0

  modelId = 1
  dataSource = typoscript
  imageFileFormat = png
  pngCompression = 0
  backgroundColor = #ffffff


  chart {
    datasets {
      0 {
        values = TEXT
        values.value = 200, 52, 47, 52, 87, 14, 180, 129
        color = TEXT
        color.value = 70a3d8
        label = TEXT
        label.value = Series A
      }
      2 {
        values = TEXT
        values.value = 50, 28, 25, 30, 41, 62, 120, 86
        color = TEXT
        color.value = 98c038
        label = TEXT
        label.value = Series B
      }
    }
    indexLabels = TEXT
    indexLabels.value = a|b|c|d|e|f|g|h
    indexLabelsDivider = TEXT
    indexLabelsDivider.value = |
  }
}
2) In the code, replace the “modelId” value with an existing model Id, and the “dataSource” value to a value that is allowed in the model.
- Still in the template TS-setup, use something like
page.10 < temp.ar_chart
to copy the plugin output to the place you want. Place this behind the first snippet, else “temp.ar_chart” won't most likely contain anything.
4) In the model, make sure that data source, chart type, dimensions etc. are set.
- Clear caches, and see the chart on the page.
Known problems
No problems known.
But: please consider this version as a real Beta version . (and not something like “we'll call it beta because G**gle does it as a standard, too”). It's the initial realease of an extension that was programmed directly for use by the Typo3 community, and not the publication of a result that was ordered, paid, and “real life” tested by a customer. So I'd be glad if the extension was 100% bug free - but there are really far too many combinations of options, use cases, and user ideas to be sure that correct programming and extensive testing did it all.
Please report any bugs you might run into to arne.wagner.typo3@web.de - thanks for your help!
To-Do list
Many ideas for things to implement. I just had to stop at a point where the extension is good for use, and react on user input from here - what is needed, what not?
Among the list are
- adding some “auto”-like option for bar width / spacing definition
- adding “fix value” model type
- some TCEform and flexform usability improvements
- putting text definitions in a separate table for easy re-use
- allowing several font files, have them defined by the administrator and selected via dropdown in the model
- add new chart types, and add a 3D option to all existing ones
- make an “examples” extension that enables “out of the box” use
- implement a mechanism for automatic file removal
- enable frontend localization
- enable versioning
- more hooks, e.g. for user-defined chart types
- and many more...
If you think of a feature that you'd like to see in this extension, let me know for future versions (mail to arne.wagner.typo3@web.de ). As always with open source programmers: making a donation might considerably speed things up...
 EXT: Charts - 23