DEPRECATION WARNING
This documentation is not using the current rendering mechanism and is probably outdated. The extension maintainer should switch to the new system. Details on how to use the rendering mechanism can be found here.
Introduction
This chapter aims to provide some information about the purpose of the TYPO3 CMS Extension, how it works and how the setup looks like.
How the Extension Works
The TYPO3 Nagios® Extension gathers some information about the TYPO3 CMS system and passes these details on to a Nagios® server. The Nagios® server parses and analyses the data and react appropriately according to its configuration. Both parts (the Nagios® server and the TYPO3 extension) build a system that enables system administrators to monitor a large number of TYPO3 CMS servers and notify administrators about a suspicious condition of one or more TYPO3 instances.
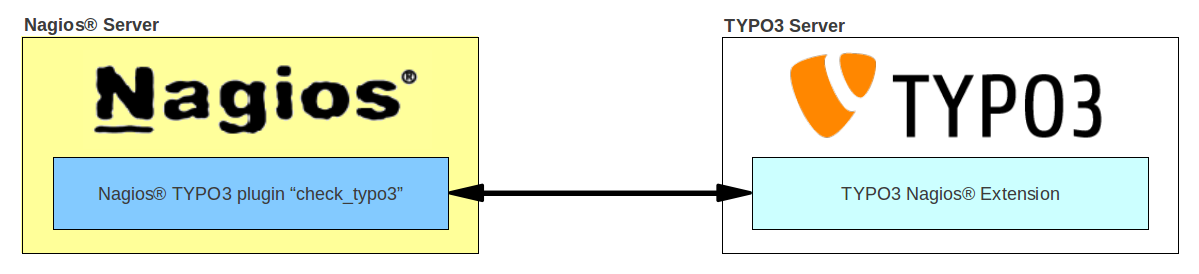
Illustration 1: Nagios server and TYPO3 instance
The Nagios® server (left) contains the Nagios® TYPO3 plugin which communicates via HTTP (see next section) with one or more TYPO3 servers. The other side - the TYPO3 server (right) - contains the TYPO3 Nagios® Extension (which is described in this document).
A typical use case for Nagios® and this TYPO3 CMS extension is to monitor a server farm with dozens of TYPO3 servers and to ensure the infrastructure is up-to-date and in a secure and "healthy" condition.
This documentation focuses on the TYPO3 extension predominantly. The counterpart (the Nagios® server and the check_typo3.sh plugin) is briefly described in chapter Nagios Server Plugin Configuration. Further installation and configuration instruction are available at schams.net.
Detailed Overview
Nagios® is the de-facto standard of open source network and server monitoring. It is a powerful monitoring system that enables organizations to identify and resolve IT infrastructure problems before they affect critical business processes. A professional hosting infrastructure includes one or more monitoring instances in order to check if the network, the servers and the services are all up and running and in working order. A Nagios® server monitors those things and notifies system administrators if a suspicious condition or a fatal error (e.g. service response too slow, server not reachable, maybe down?) occurs.
Nagios® comes with a comprehensive set of checks off the shelf including PING (server alive), disk space, server load, free memory, etc. (on a server level) but also SMTP, SSH, HTTP response, etc. (on a service/application level). Apart of those basic checks Nagios® allows system administrators to implement and configure their own checks.
The TYPO3 Nagios® Extension in combination with the TYPO3 check plugin for Nagios® (check_typo3.sh) enables system administrators to gather information from a TYPO3 system and to react if the web instance reports a specific condition.
In a practical sense this means system managers can be warned if a TYPO3 server runs with a specific (e.g. outdated) version of TYPO3 (or PHP) or TYPO3's deprecation logging is enabled (and the log file fills up the disk space on a production server) or (a very simple but maybe the most used scenario) the TYPO3 server is not responding (unable to report anything) at all.
The Nagios® server is optimized for running on a Linux/UNIX server but is able to monitor all kinds of servers, services and network devices (e.g. Windows/Mac/Linux/UNIX machines, Netware servers, routers/switches, network printers and publicly available services such as HTTP, FTP, SSH, etc.).
Read more about Nagios® and monitoring strategies at the following sites.
- the official Nagios® web site: http://www.nagios.org
- Nagios® at Wikipedia (English): http://en.wikipedia.org/wiki/Nagios
- Overview of Network Monitoring Systems: http://en.wikipedia.org/wiki/Comparison_of_network_monitoring_systems
The following sub-sections provide further details and insights: