For Editors
Target group: Editors
This extension will support editors & authors by providing
- ability to manage datasets consisting of data and labels
- fluid based content elements to display different chart types like bar, line, pie and etc.
Hint
The usage of generating chart data can be improved by Spreadsheet extension. So don't hesitate to check out that extension too 😁
Chart Dataset
Before creating a chart content element you need to create a dataset that can be used by chart libraries. Go to list view and create a new chart data record. On default labels, data and data labels are configured with TYPO3's table wizard.
Per default you can create a dataset by using TYPO3's table wizard as you can see in following screenshot. This dataset can then be adjusted by additionally using custom colors for background/border inside of the colors tab. See color palette editor for more information how to edit colors.


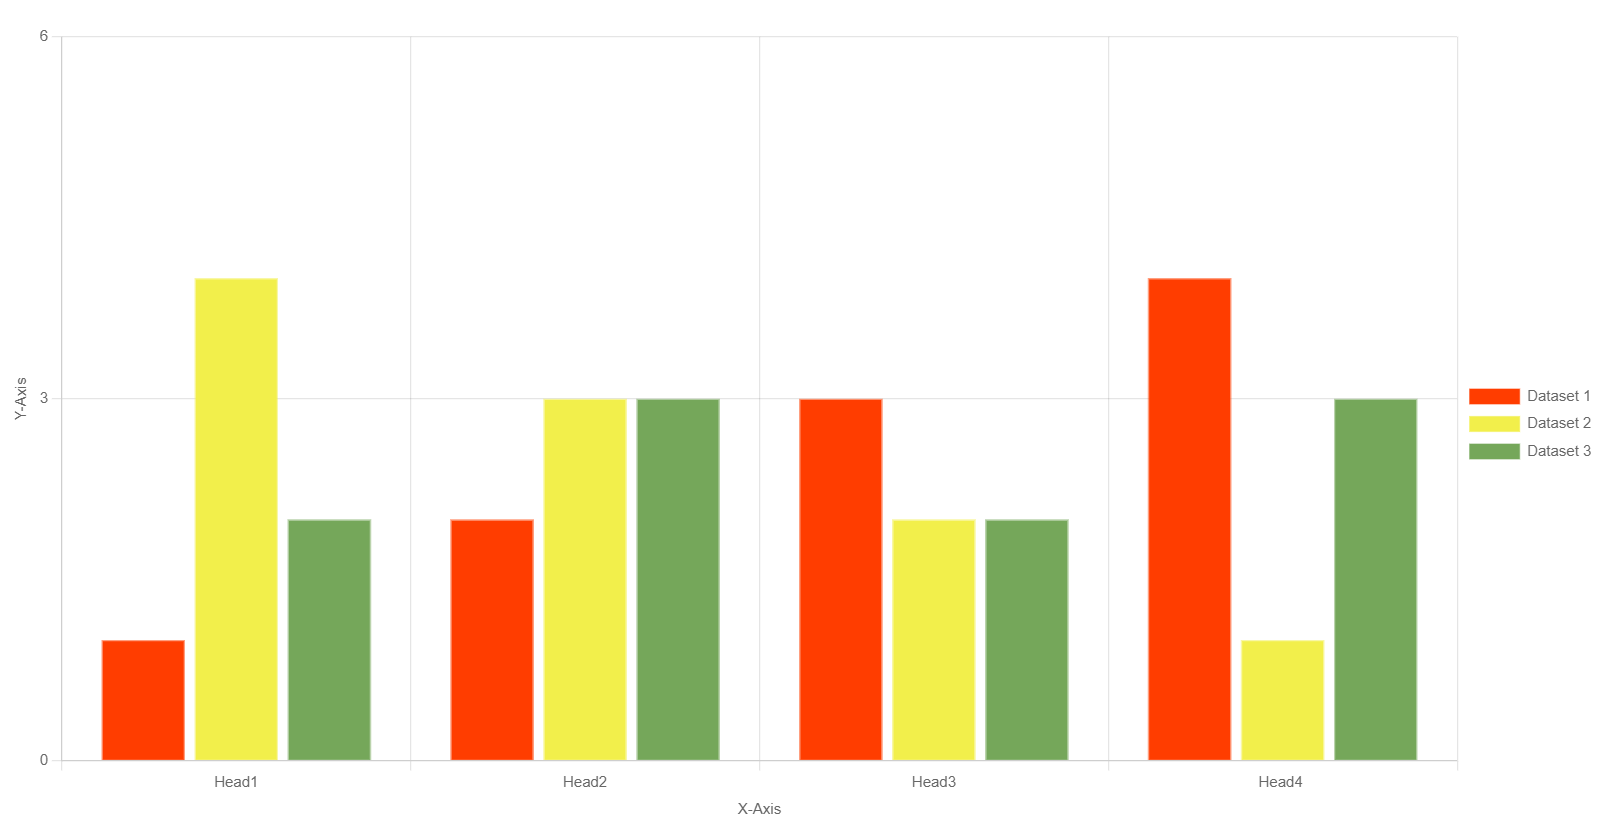
With such configuration the frontend will render for example the following Bar Chart.
Spreadsheet-based
Following screenshots show how to create same dataset with spreadsheet data if your TYPO3 installation also provides the spreadsheet extension.


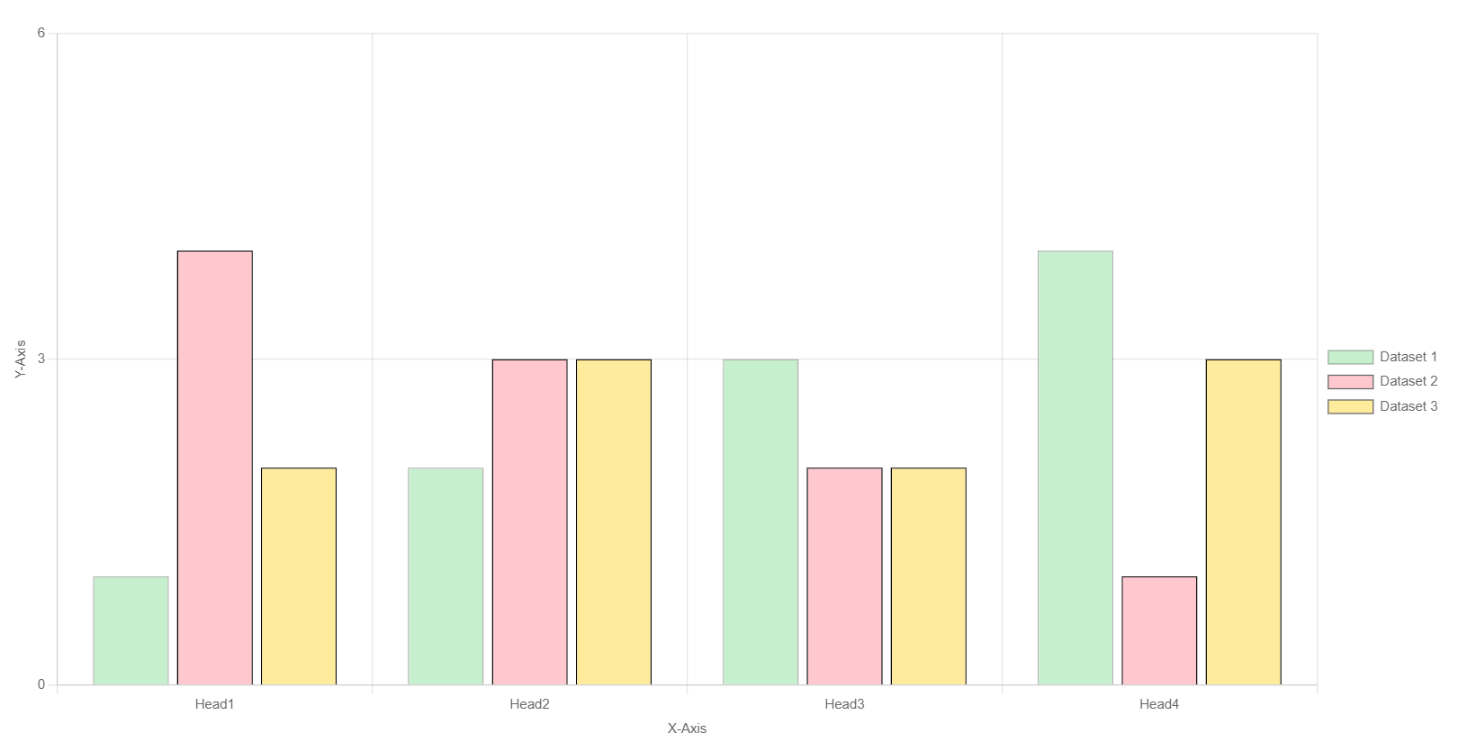
This spreadsheet configuration does not have configured colors and thus uses the provided colors from spreadsheet cells. The following output may be rendered in frontend.
Color Palette Editor
The color palette helps to define background and/or border configuration for your chart output in frontend. After clicking on a palette a modal will open that shows the whole palette. Hover over an item to see the actions. You can move or delete items. With a click on the Hex-Code the color-picker will open and you can change the color by moving the pickers or typing the values for red, green, blue and/or alpha by yourself. As an addition you can also adjust the HSV values (learn more on HSL and HSV).


Content Element
Start adding a new content element to your page as usual and select the tab "Charts" to see following overview:

FAQ
Possible subsection: FAQ