Introduction
What does it do?
With this extension you are able:
- to easily display static or dynamic chart types (bar, line, pie, etc.) from given data and labels
- to define TCA input fields that can extract selectable data from your worksheets
...but a picture is worth a thousand words so heads up to the screenshots below or dive into the editor docs 😁
Screenshots
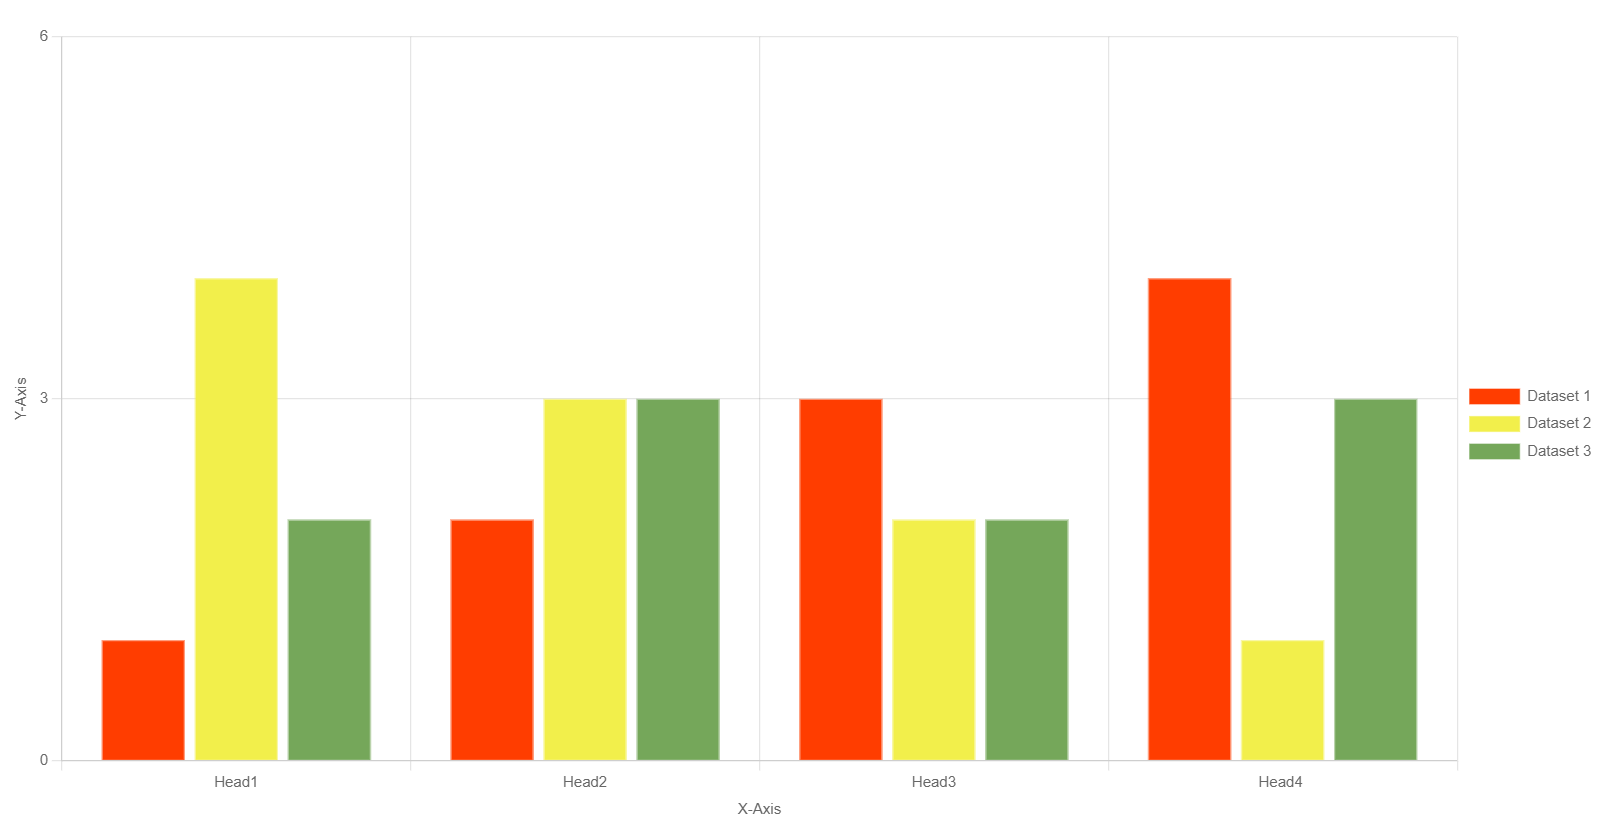
Bar Chart with plain dataset and custom color palette
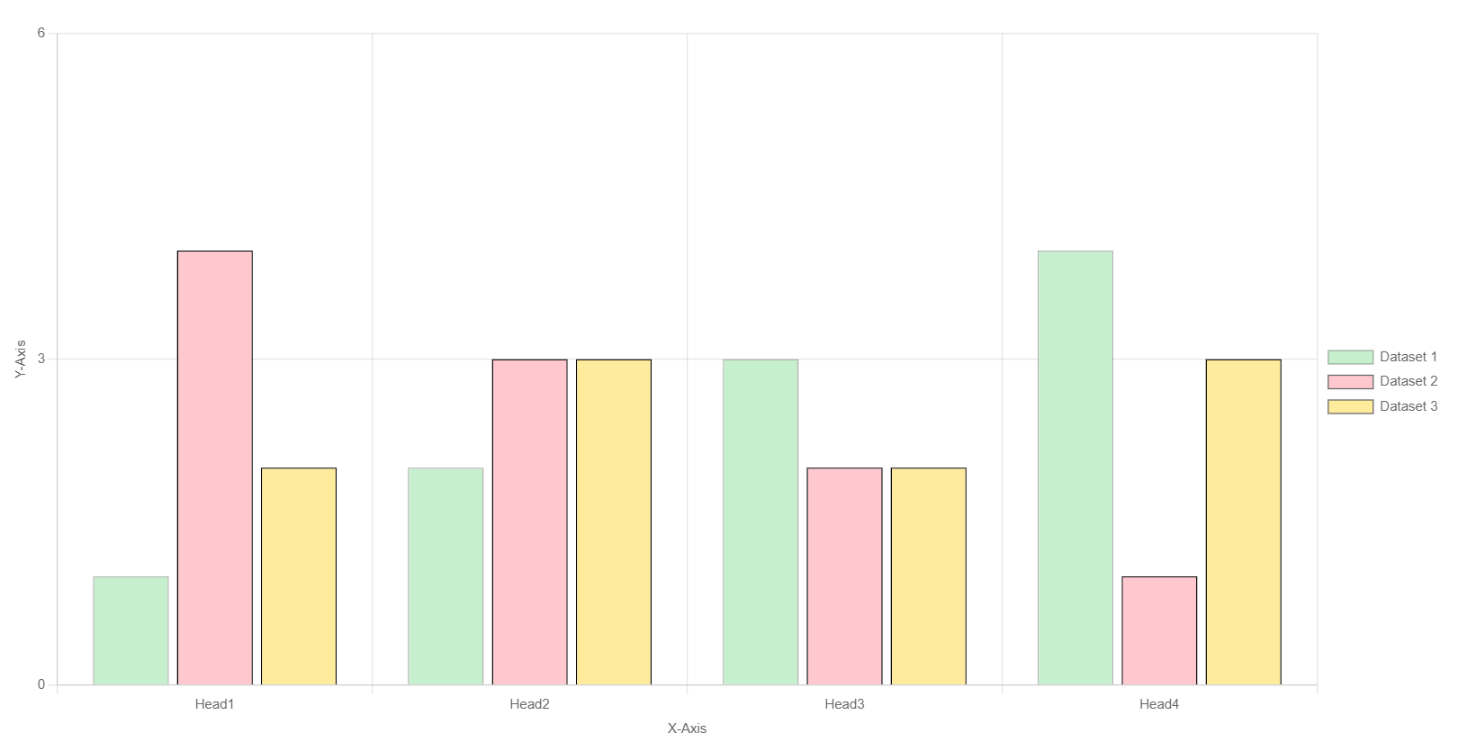
Bar chart using data and colors from spreadsheet
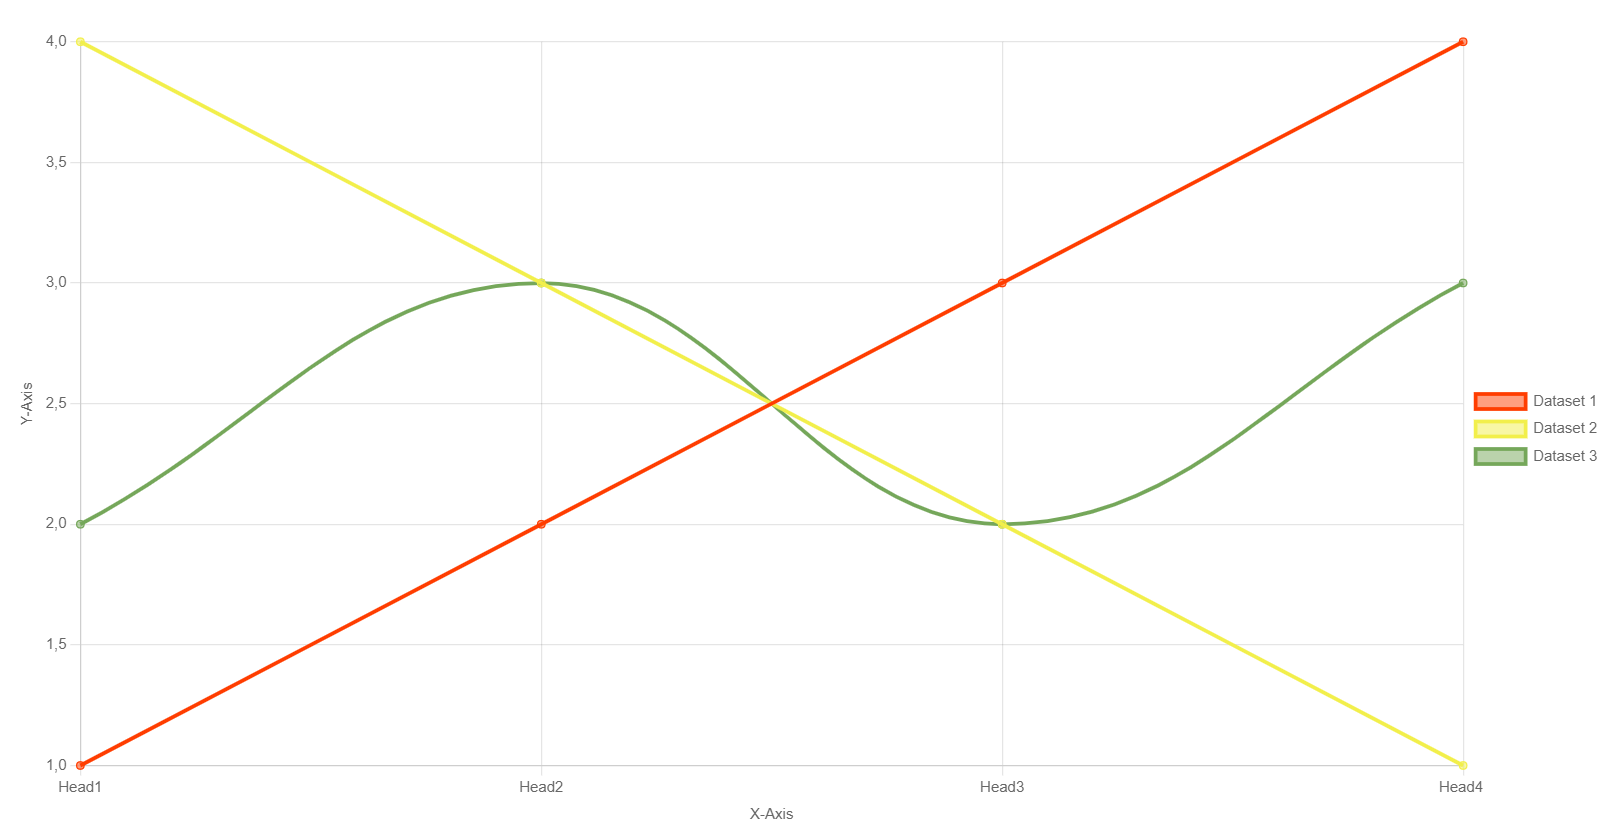
Line Chart with plain dataset and custom color palette
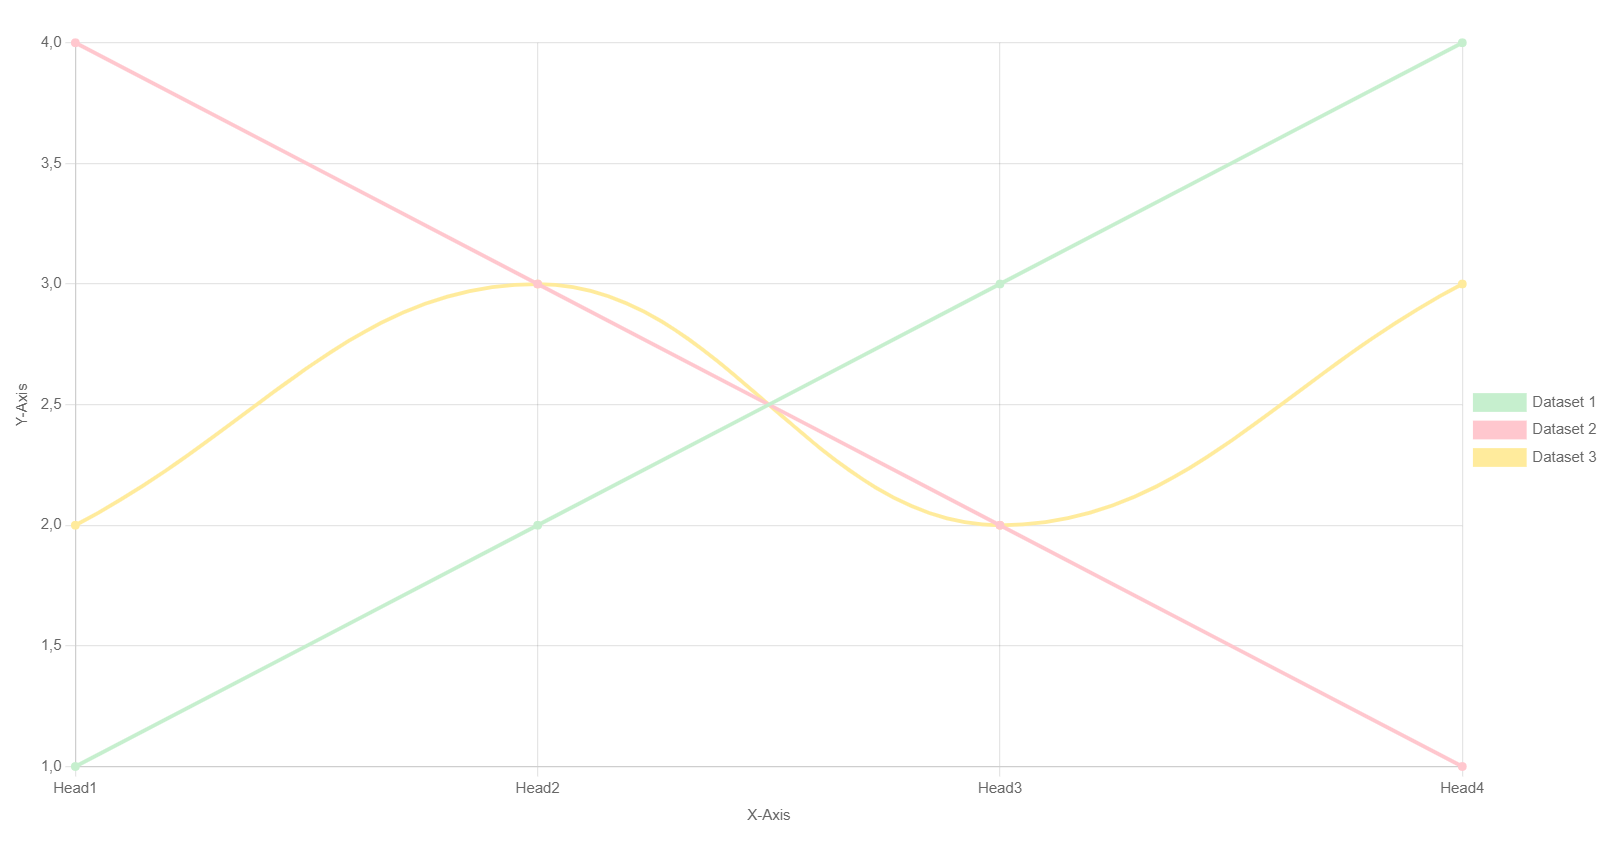
Line chart using data and colors from spreadsheet
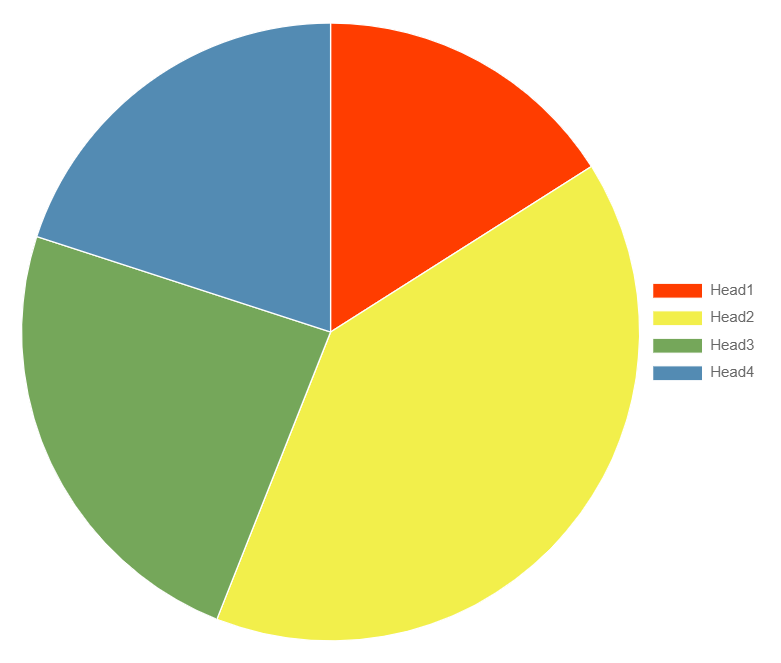
Pie Chart with plain dataset and custom color palette
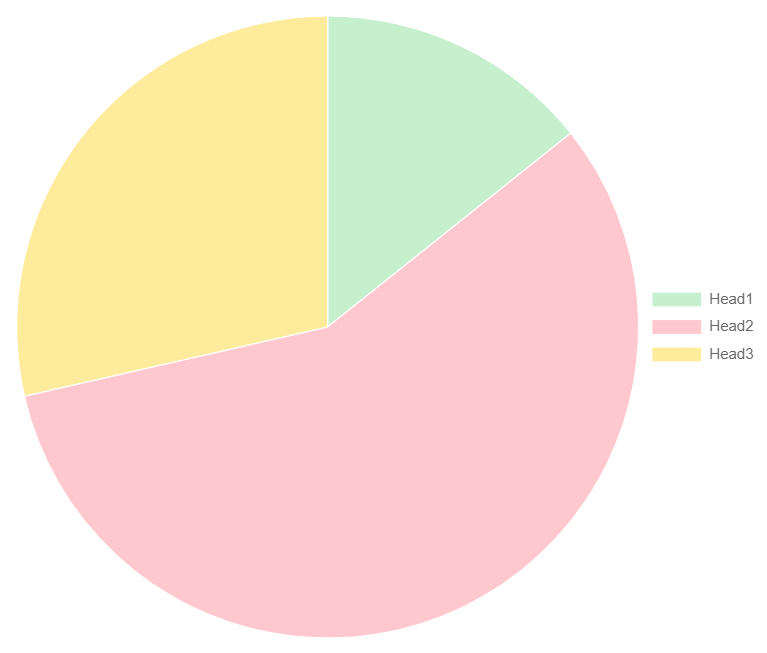
Pie chart using data and colors from spreadsheet
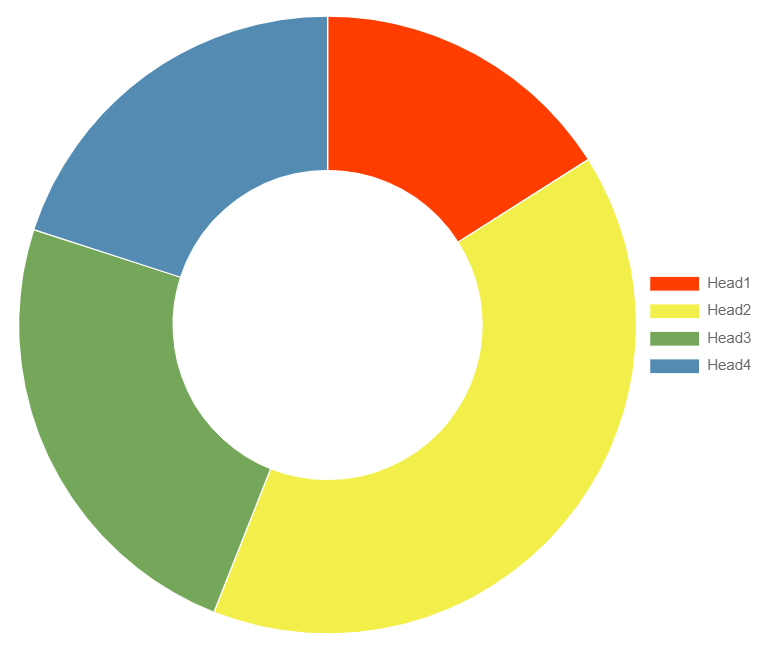
Doughnut Chart with plain dataset and custom color palette
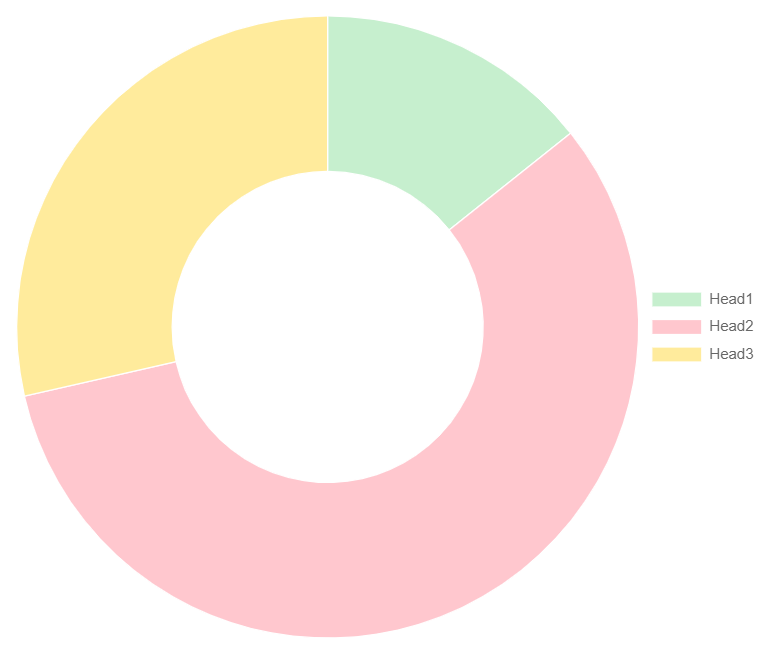
Doughnut chart using data and colors from spreadsheet
Important
Please note that above right-side examples require installation of Spreadsheet extension