
Usage analytics
The Analytics submodule turns the per-request data in
tx_ into an at-a-glance view of what your AI
spend and usage look like over time — cost and request trends,
breakdowns by provider, model, and service, and per-user consumption
against this month's budget.
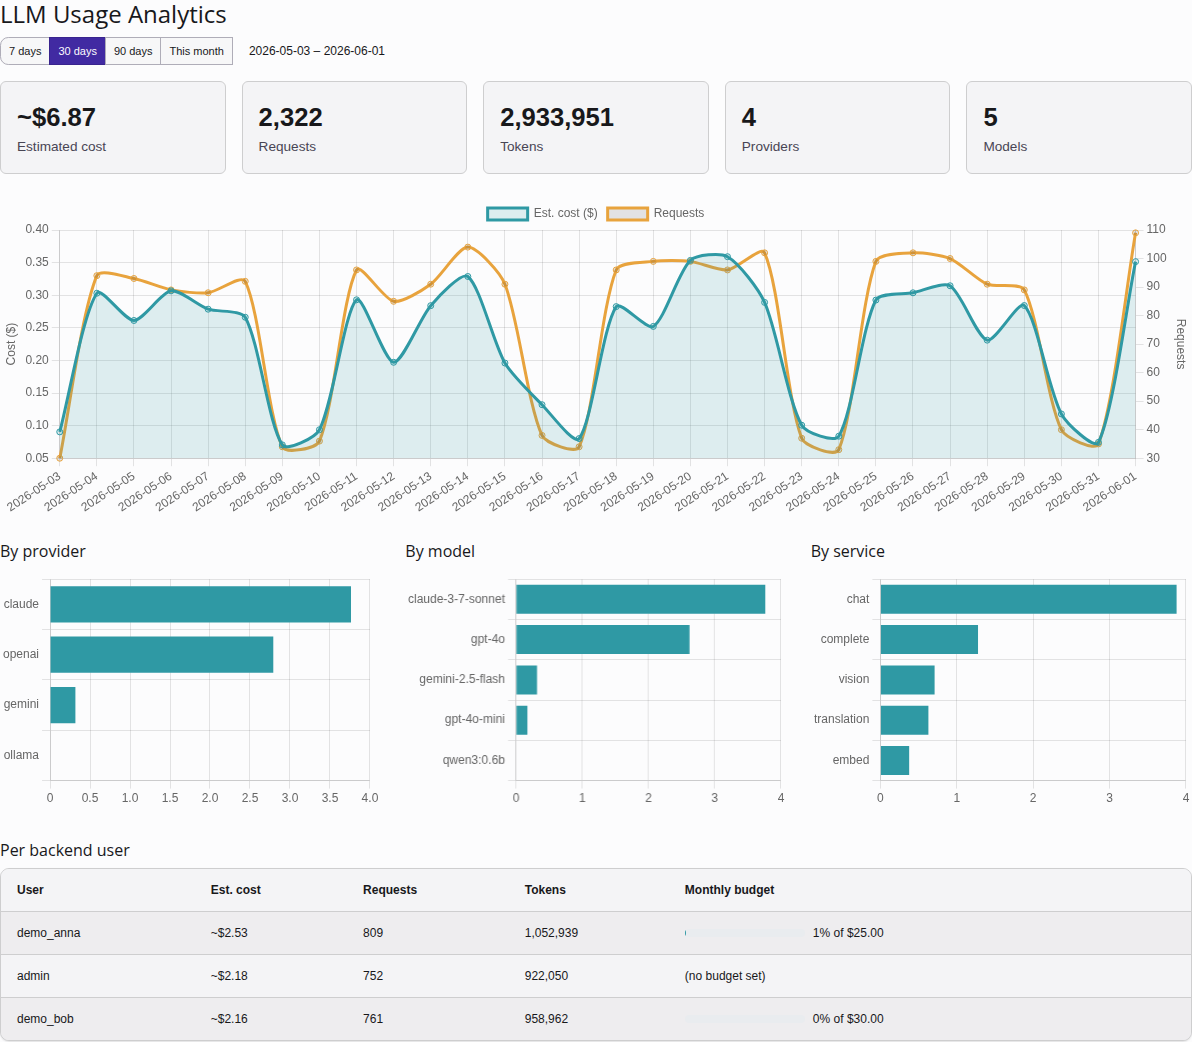
The Analytics dashboard: KPI summary tiles, the cost/request trend, the provider / model / service breakdowns, and per-user consumption against each user's monthly budget.
Opening the module
Open Admin Tools > LLM > Analytics. The submodule sits next to the other LLM sections in the left-hand navigation and is admin-only, like the rest of the module.
Choosing a date range
A range switcher at the top of the page selects the reporting window.
The range is a plain ?range= link, so changing it is an ordinary
page reload — there is no AJAX. Four presets are available:
| Preset | Window |
|---|---|
7d | The last 7 days (today and the six preceding days). |
30d | The last 30 days. This is the default — any unknown range
value falls back to 30d. |
90d | The last 90 days. |
month | From the first of the current calendar month to today. |
KPI tiles
A row of tiles summarises the selected range:
- Total cost — the summed estimated cost across the window.
- Total requests — the number of AI requests recorded.
- Total tokens — prompt plus completion tokens consumed.
- Providers — how many distinct providers were used.
- Models — how many distinct models were used.
These are totals for the chosen range, not all-time figures.
Cost and requests trend
A line chart plots daily estimated cost and daily request count across the range. Days with no usage are filled in as zero so the line is continuous rather than skipping gaps.
Breakdown charts
Three bar charts split the window's usage along different axes:
- By provider — cost and requests per
service_provider(OpenAI, Anthropic, Ollama, …). - By model — cost and requests per model. This dimension is new:
it relies on the
model_uid/model_idcolumns added to the usage table, so it only reflects usage recorded after that change. - By service — cost and requests per service type (chat, vision, translation, speech, image).
Per-user table
A table lists usage grouped by backend user, ordered by cost. Each row shows the user's request count, token total, and estimated cost for the selected range, plus a monthly-budget bar that visualises how much of their per-user budget (see Per-user AI budgets) they have consumed.
Note
The budget bar always reflects the current calendar month, regardless of the date range selected above. The other columns follow the selected range; the budget bar does not, because a budget is a monthly ceiling.
Requests made without an authenticated backend user (CLI, scheduler,
be_user = 0) are grouped under a system row.
Fallback rescues
A table lists the runs a different configuration answered after the requested one failed — each line is one request the configuration you configured did not serve. It shows what was requested and what answered, each with its provider and model, how many configurations were tried, and how long the whole run took.
Unlike the rest of this module the list is read from the telemetry log
(tx_nrllm_telemetry), not from the usage table, so it also covers
runs that produced no billable usage.
Two things it deliberately does not show:
- Runs nobody served. A chain that was tried and exhausted names no serving configuration — it is a failure, not a rescue, and appears in the provider health scores instead.
- Runs recorded before this feature existed. Rows written by an older version carry no serving configuration and are left out rather than guessed at.
At most the 200 newest rescues of the period are listed. The limit counts rescues, not failed attempts, so a long outage — which writes one row per request — cannot push the rescues out of the list.
A configuration appearing here repeatedly is the signal to look at: its calls are being answered by a sibling, which may use a different provider, model and price than the one you selected.
Provider health and circuits
A table lists every provider that is either configured and active or named by a run in the telemetry window, with its health score, the number of samples the score is based on, the window those samples were taken over, and the state of its circuit breaker.
Health and circuit state are both keyed by adapter type, not by provider record — two provider records on the same adapter share one score and one circuit, because it is the provider that is unhealthy, not the record.
Note
Direct calls with a pinned provider are not in this table.
chat, complete, embed and their siblings
called with a provider option skip the default configuration
entirely and run against a transient one carrying no model. Such a run
records no provider in the telemetry log, and its circuit is kept
under the call's own identifier (ad-hoc:chat:openai, one per
operation) rather than under openai. An openai row here
therefore reports the circuit of the configuration-backed calls only;
a circuit opened for direct pinned calls is not shown anywhere on this
page. Route traffic through a configuration if you need it covered.
| Column | Meaning |
|---|---|
| Score | A single 0.00–1.00 number combining success rate and mean latency, success rate weighted four times as heavily (see ADR-063: Provider Resilience — Circuit Breaker, Health, Idempotency). Higher is healthier. |
| Samples in window | How many runs the score was computed from. Read it before the score: 0.90 over two calls and 0.90 over two thousand are different statements. |
| Success rate | Share of runs the provider served itself. A run a fallback rescued counts as a failure of the requested provider. |
| Avg latency | Mean end-to-end time of the self-served runs. A provider whose runs
in the window were all rescued by a fallback has no self-served
run to measure: the cell says the latency was not measured instead
of showing 0 ms. Its score and success rate are real — the
first attempt did lose. |
| Circuit | closed (normal), open (failing fast for the cooldown) or
half-open (cooldown elapsed, one probe due), plus the current
consecutive-failure streak. |
Unlike the rest of this module the table ignores the date range selected above. Scores come from a rolling telemetry window (15 minutes by default, named on the page) and circuit state is live cache state — neither can be re-cut to a 90-day report period.
Important
A score only changes something when you switched it on.
Health-Aware Fallback Reorder (health.reorderFallback
in the extension configuration) is off by default. While it is
off, the scores are diagnostic only: the fallback chain keeps the
order you configured. The page states which of the two positions the
switch is in, above the table. The circuit breaker
(circuitBreaker.enabled) is on by default, and the page says so
when it is not.
A provider with no telemetry in the window shows no data — not a score of zero. It was not called; that is not the same as failing.
A note on cost
All cost figures are estimated. They are computed from the model pricing you configured (cents per 1M tokens, applied to the recorded prompt/completion token split), not billed back from the provider. Treat them as a planning and trend signal, not as an invoice. Costs are captured at call time, so they reflect the pricing in effect when each request ran. See ADR-029: Usage Analytics Dashboard for the design rationale.
Specialized services (DALL·E, text-to-speech, Whisper, DeepL) still
record their requests and units, but their cost is currently shown as
0 — token-based pricing does not apply to them yet. Streaming
responses are not recorded at all, because chunked output has no single
terminal token count to price.
Usage columns in the list views
The Providers, Models, Configurations, and Tasks list views each carry three extra columns — Cost (30d), Requests (30d) and Tokens (30d) — summarising the last 30 days of usage for that row, so you can spot the heavy hitters without leaving the list.
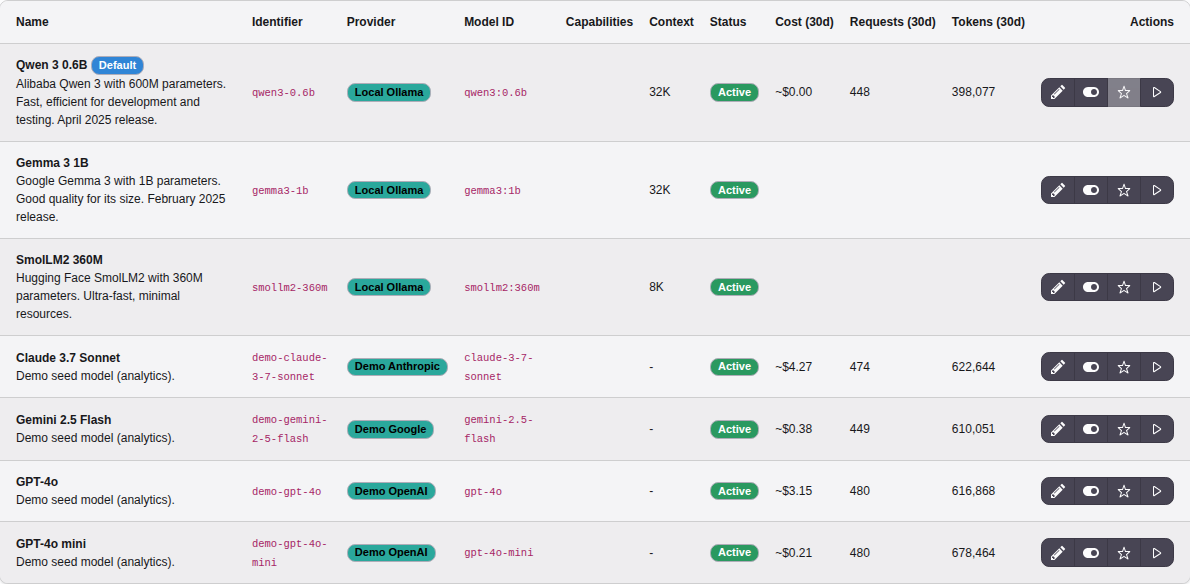
The Models list with the 30-day usage columns. Models with no usage
in the window show blank cells; free local models show ~$0.00.
Two attribution notes:
- The Providers column aggregates by adapter type (the value stored on each usage row), not by individual provider record — two providers that share an adapter therefore show the same figures.
- The Tasks column relies on per-task tracking: each task execution
records its
task_uidso usage rolls up to the task that triggered it. Calls made outside a task (direct API/service use) are not attributed to any task row.
Demo data for local development
To populate the module with something to look at during local development, run the dev-only DDEV command:
ddev seed-usageIt generates roughly 90 days of realistic historic usage across providers, models, services, and users so the trend line, breakdown charts, and per-user table all have content. This command is for local DDEV environments only — do not run it against production data.