DEPRECATION WARNING
This documentation is not using the current rendering mechanism and is probably outdated. The extension maintainer should switch to the new system. Details on how to use the rendering mechanism can be found here.
Dealing with functions: the “return” attribute
The JpGraph library makes it possible to display curves from functions. In this case, the “FuncGenerator” is used and the returned values become the data to process.
Let use illustrate the concept on the funcex1.php example. Instructions relative to the FuncGenerator is:
$f = new FuncGenerator('cos($x)*$x');
list($xdata,$ydata) = $f->E(-1.2*M_PI,1.2*M_PI);
The evaluation of the expression is done by means of the “E” method which returns a two-dimensional arrays of data.
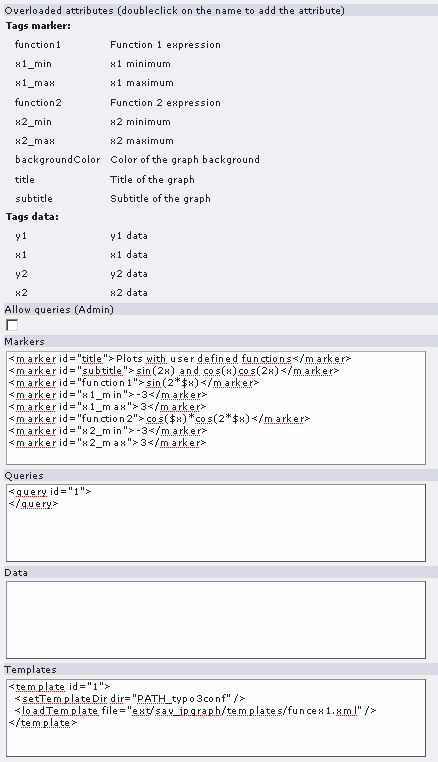
To translate this in XML, the “return” attributes will be used and data will be accessed through reference attributes and the <setDataFromArray> tag. It gives:
<FuncGenerator id="1" func="cos($x)*$x">
  <E xmin="-4" xmax="4" return="data#1" />
</FuncGenerator>
<data id='x1'>
  <setDataFromArray ref="data#1" index="0" />
</data>
<data id='y1'>
  <setDataFromArray ref="data#1" index="1" />
</data>
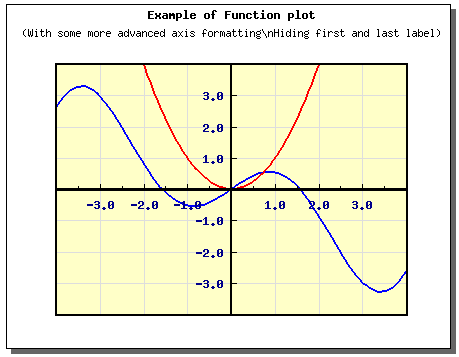
Displaying the template leads to:
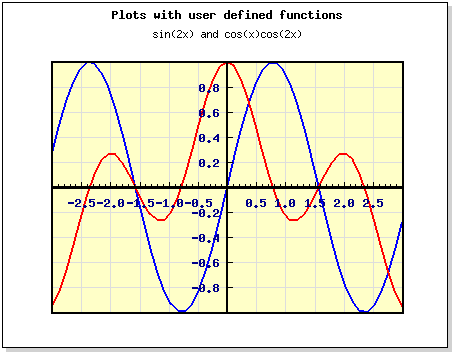
Once again, by means of markers, the functions to display can be easily changed in the content flexform.
The result in FE becomes: