DEPRECATION WARNING
This documentation is not using the current rendering mechanism and is probably outdated. The extension maintainer should switch to the new system. Details on how to use the rendering mechanism can be found here.
Designing a basic XML template from an example
Introduction
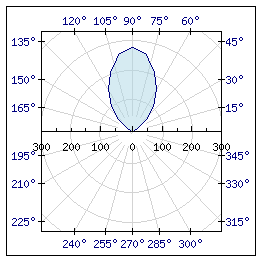
The JpGraph library includes hundreds of examples. They are in the directory “Classes/JpGraph/Examples”. Let us illustrate the principle on a simple example: polarex0.php. The file content is given below.
<?php
// A simple Polar graph, example 0

include "../jpgraph.php";
include "../jpgraph_polar.php";

$data = array(0,1,10,2,30,25,40,60,
              50,110,60,160,70,210,75,230,80,260,
              85,270,90,280,
              95,270,100,260,105,230,
              110,210,120,160,130,110,140,60,
              150,25,170,2,180,1);

$graph = new PolarGraph(250,250);
$graph->SetScale('lin');
$graph->SetMargin(35,35,25,25);

$p = new PolarPlot($data);
$p->SetFillColor('lightblue@0.5');
$graph->Add($p);

$graph->Stroke();

?>
Translating Data
Data will be inserted in a XML tag <data> with an “id” attribute (“id” is a reserved word) to reference later these data. It gives:
  <!-- Define the default data -->
  <data id="defaultData">
0,1,10,2,30,25,40,60,
50,110,60,160,70,210,75,230,80,260,
85,270,90,280,
95,270,100,260,105,230,
110,210,120,160,130,110,140,60,
150,25,170,2,180,1
  </data>
Translating new Object
Each time a JpGraph new object is created in php, transform it in a XML tag. The parameters become attributes. Thus,
$graph = new PolarGraph(250,250);
becomes
<PolarGraph width="250" height="250">
</PolarGraph>
You can use any name for the attributes, however it is always better to use names that makes sense. For example, you can use the same name as the parameter in the php class . The order of the values must be the same as in php.
Translating methods associated with objects
For each method, define a tag with the same name with attributes in the same order. Once again, the name for attributes is your choice. Put this tag inside the tag associated with the object. Thus,
$graph->SetMargin(35,35,25,25);
becomes
<SetMargin left="35" right="35" top="25" bottom="25" />
Because, “$graph” is associated with the tag “PolarGraph”, the previous tag should be inserted inside it. Thus, it gives:
<PolarGraph width="250" height="250">
  <SetMargin left="35" right="35" top="25" bottom="25" />
</PolarGraph>
Setting reference to already defined objects
As you can see in the php code, a PolarPlot object is created and is “added” to the PolarGraph by means of the statement:
$graph->Add($p);
In such a case, always define the graphic element before as described previously and give it an identification by means of an “id” attribute. In order to associate the data as in the “new PolarPlot($data”);” statement, we will use a “ref” attribute (“ref” is a reserved word). The syntax is “tagName#id”. For example “data#defaultData” refers to the <data> tag whose id is “defaultData”. Thus, we obtain:
<!-- Define the plot -->
<PolarPlot id="1" ref="data#defaultData">
</PolarPlot>
Now, we can add the PolarPlot to the PolarGraph using the “id” of the PolarPlot:
<!-- Define the graph -->
<PolarGraph width="250" height="250">
  <SetMargin left="35" right="35" top="25" bottom="25" />
  <Add ref="PolarPlot#1" />
</PolarGraph>
Saving the resulting image filename
The resulting image should be provided to the method “Stroke” ($graph->Stroke();). A predefined file name is set by the extension. The filename is “typo3temp/sav_jpgraph/im_xxxx.png” where “xxxx” is the content object id. This file is defined by means of a hidden XML <file> tag whose id is “1”. Therefore, you must translate the “Stroke” call in:
<Stroke ref="file#1" />
The simple XML template
After applying all the previous rules, the resulting template is:
<?xml version="1.0" encoding="utf-8"?>
<jpgraph>

  <!-- Define the default data -->
  <data id="defaultData">
0,1,10,2,30,25,40,60,
50,110,60,160,70,210,75,230,80,260,
85,270,90,280,
95,270,100,260,105,230,
110,210,120,160,130,110,140,60,
150,25,170,2,180,1
  </data>

  <!-- Define the plot -->
  <PolarPlot id="1" ref="data#defaultData">
    <SetFillColor color="lightblue@0.5" />
  </PolarPlot>

  <!-- Define the graph -->
  <PolarGraph width="250" height="250">
    <SetScale type="lin" />
    <SetMargin left="35" right="35" top="25" bottom="25" />
    <Add ref="PolarPlot#1" />
    <Stroke ref="file#1" />
  </PolarGraph>

</jpgraph>
Displaying the template
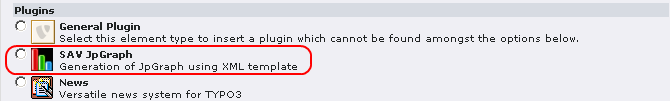
Insert a new content in your page and select the SAV JpGraph plugin.
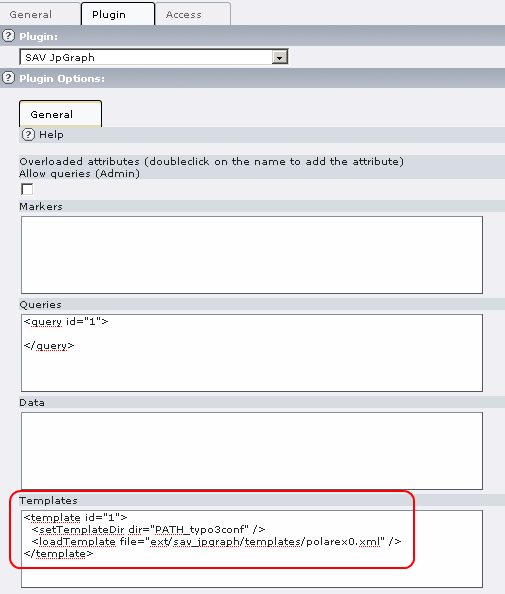
The extension comes with a flexform with predefined XML elements. Fill the Templates part as shown below. The tag <setTemplateDir> is used to set the directory root by interpreting TYPO3 constant. You can use predefined php constants in any tag, they will be replaced by their value. Use the tag <loadTemplate> to load the template. The following configuration will load the template file “typo3conf/ext/sav_jpgraph/templates/polarex0.xml”.
Finally, view your page and you should obtain the following display.