
Dashboard widgets
The extension provides four widget types for the TYPO3 dashboard. Each widget type is available in a TYPO3 v13 variant (inline dropdowns, AJAX-driven) and a TYPO3 v14+ variant (native widget settings panel).
All v14+ widgets share two common settings:
| Setting | Type | Default | Description |
|---|---|---|---|
| Title | string | (widget default) | Overrides the widget title shown in the dashboard header. Leave empty to use the default. |
| Show site & period in title | bool | true | Appends the site name and period in parentheses to the title, e.g. Traffic Sources (My Site · 7 days). |
Traffic Graph
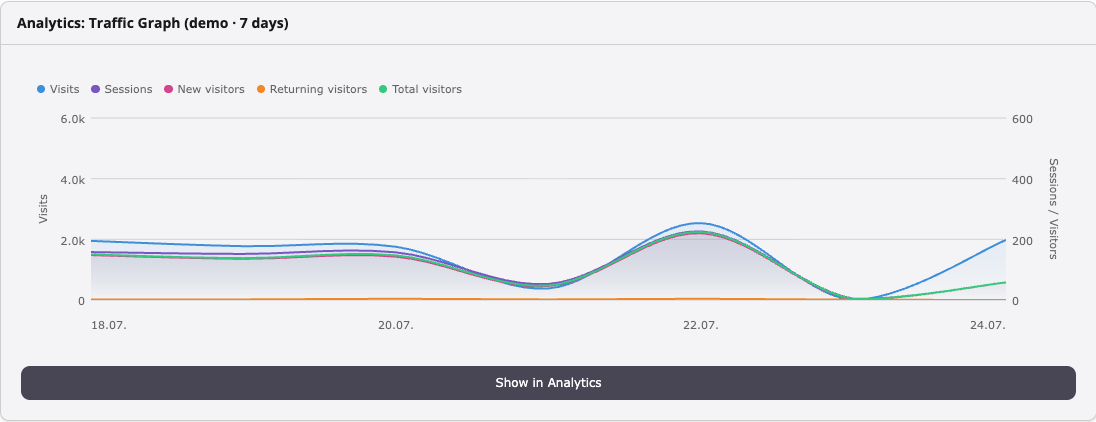
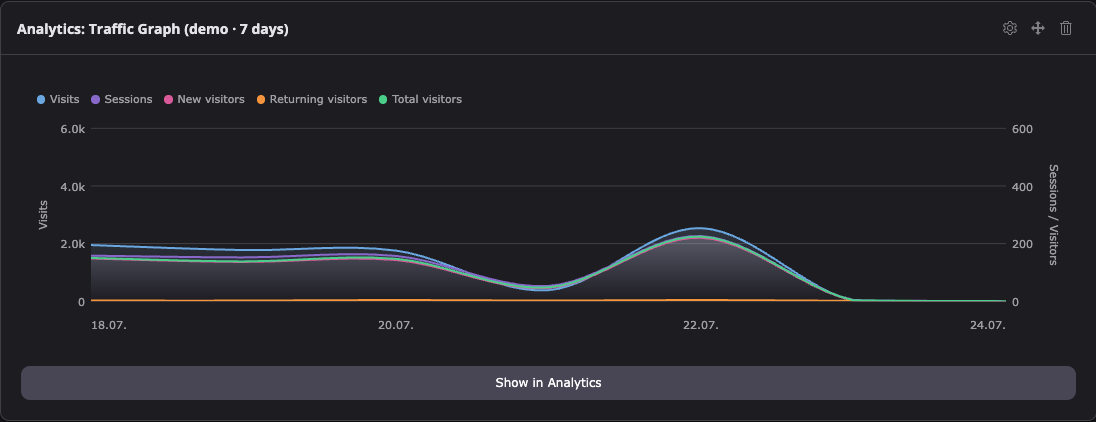
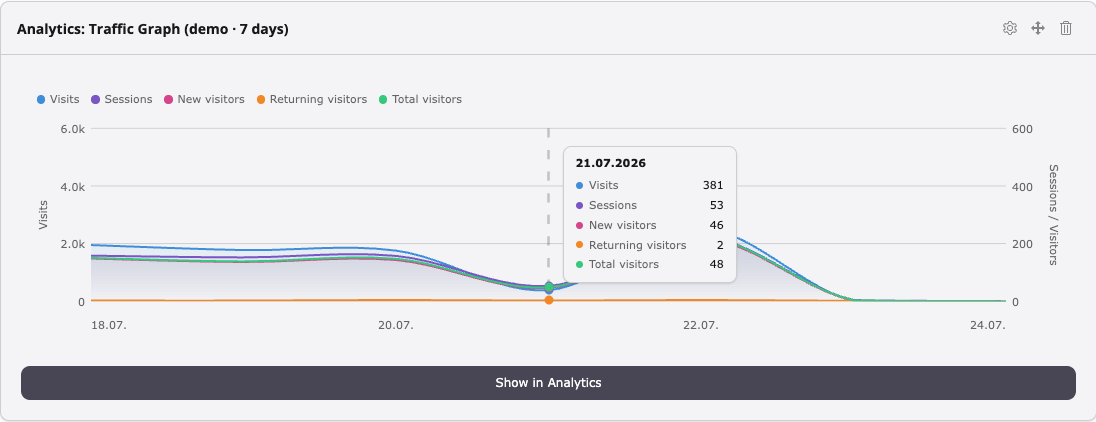
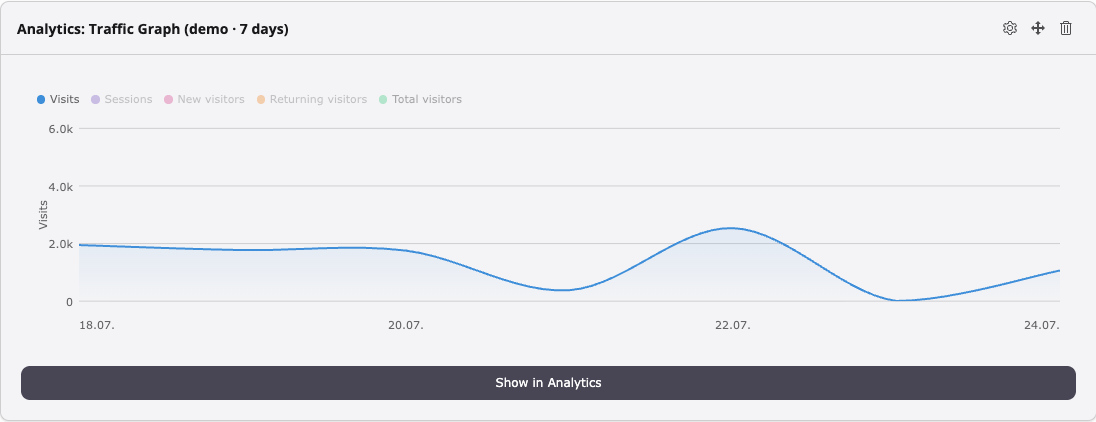
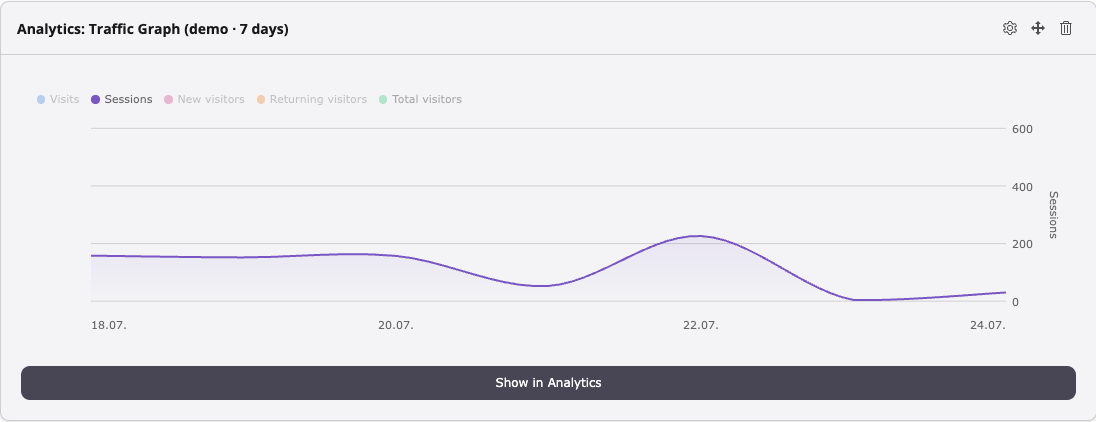
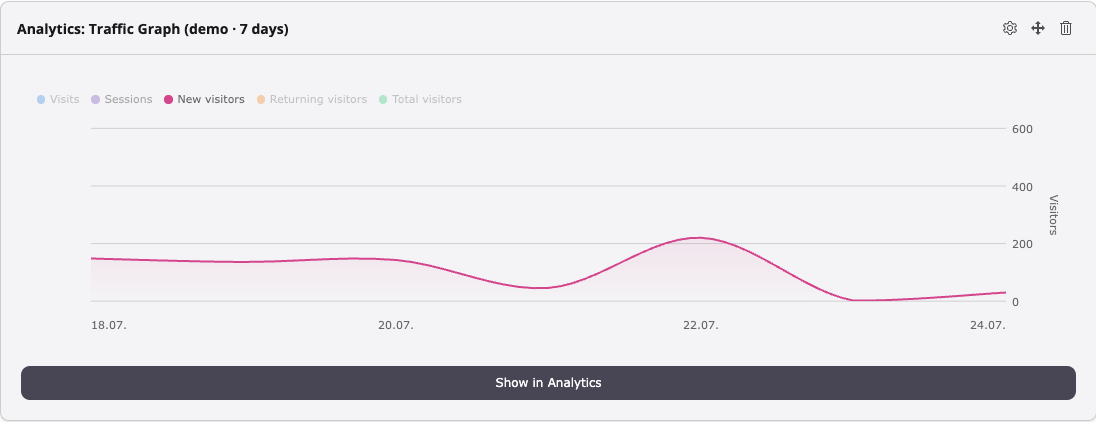
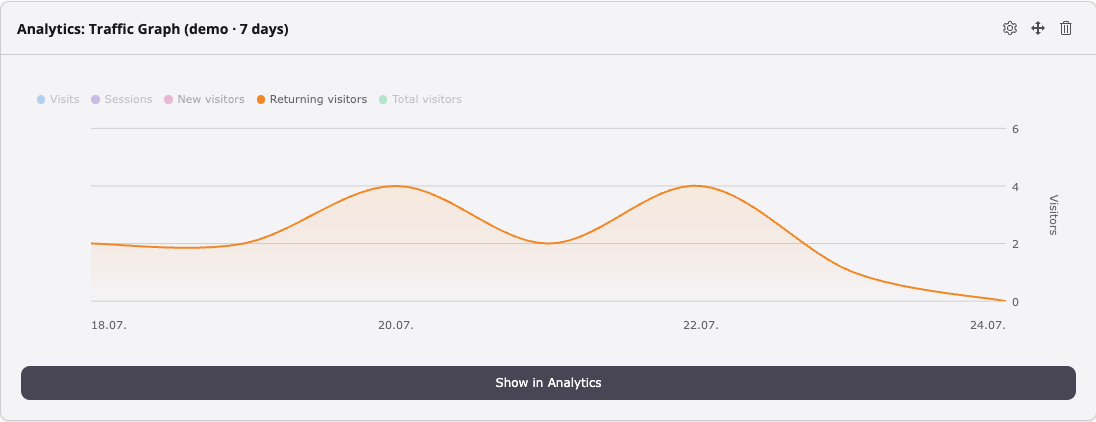
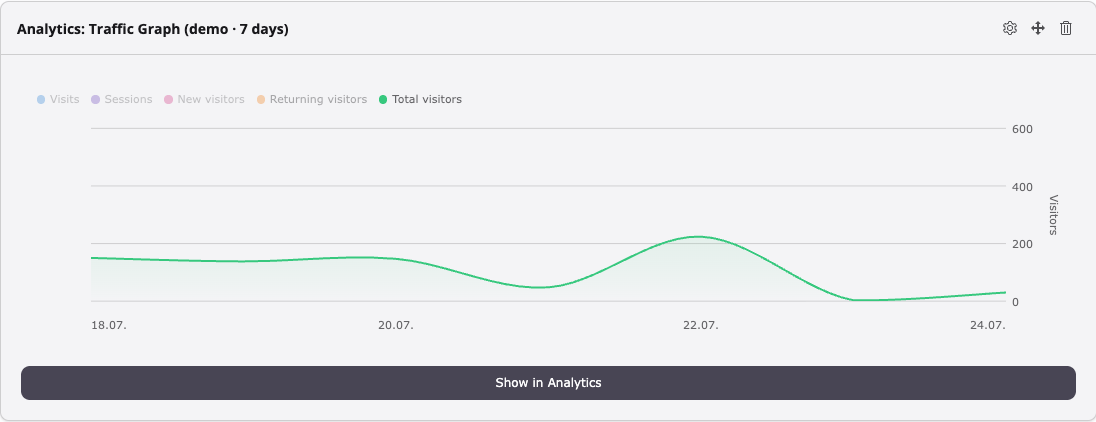
Displays a full-width line chart of daily visit counts for a configured site over the selected period. A Show in Analytics link opens the main analytics dashboard.
Each metric in the legend (Visits, Sessions, New visitors, Returning visitors, Total visitors) can be toggled on and off individually by clicking its legend button — useful for focusing on a single data series. The y-axis rescales automatically to the visible data range when series are toggled. Hovering over the chart reveals a tooltip with exact values for that date.
Widget settings (v14+): Site, Period (days).
Site Performance
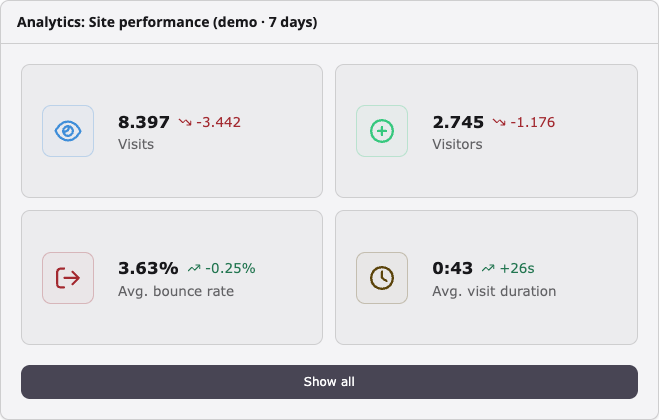
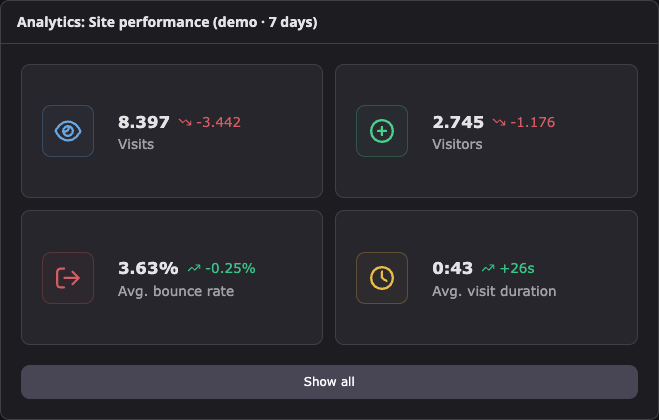
Displays four metric tiles — Visits, Visitors, Bounce rate, and Avg. visit duration — each showing the current value and a trend arrow compared to the previous period of equal length. A Show all link leads to the analytics dashboard.
Widget settings (v14+): Site, Period (days).
Top Pages
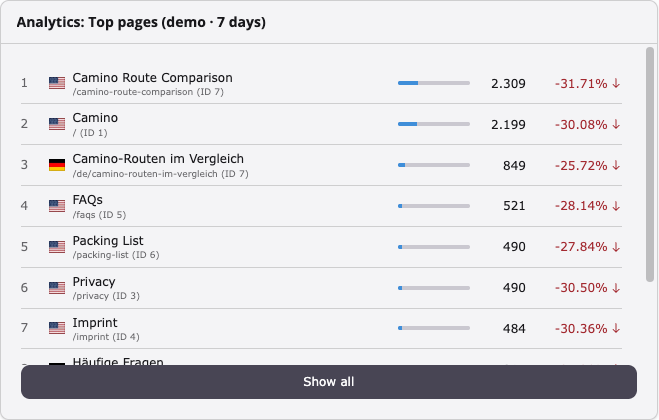
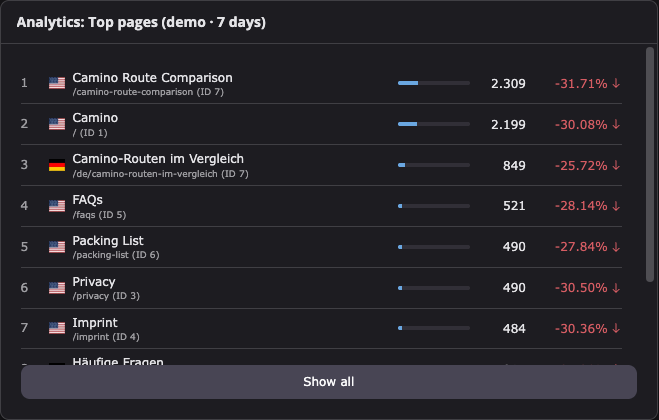
Displays a ranked list of the most-visited pages for a configured site. Each row shows the page title, URL, and view count. A Show all link leads to the pages view of the analytics dashboard.
Widget settings (v14+): Site, Period (days), Limit (number of pages shown).
Traffic Sources
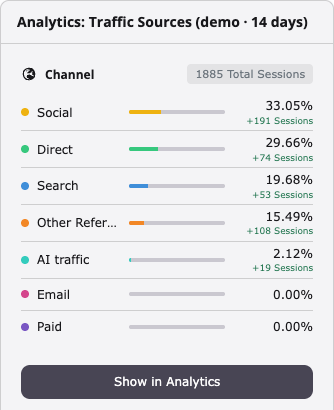
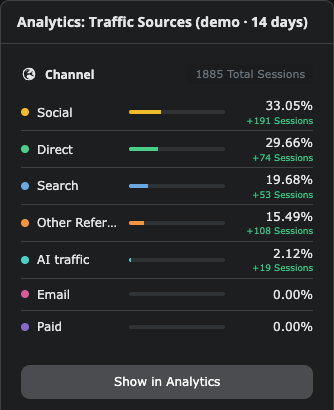
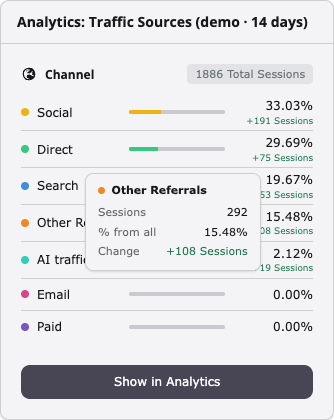
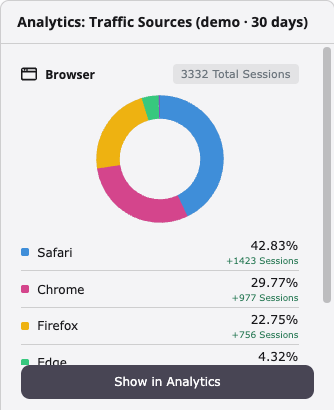
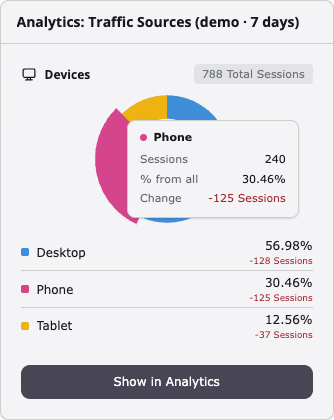
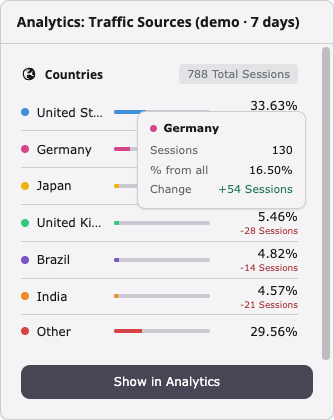
Displays a breakdown of incoming traffic by channel, browser, device type, or country. Entries outside the top results are aggregated into an "Others" row. Donut chart variants support hover interaction: hovering over a segment pulls it out slightly and shows a tooltip with the session count, percentage, and comparison to the previous period.
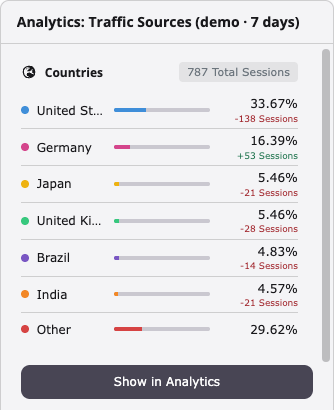
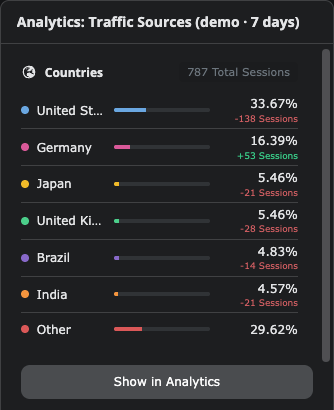
On TYPO3 v14+, four separate widgets are registered — one per section:
| Widget | Section | Default chart type |
|---|---|---|
| Traffic Sources: Channel | Channel | List |
| Traffic Sources: Devices | Devices | Donut |
| Traffic Sources: Browser | Browser | Donut |
| Traffic Sources: Countries | Countries | List |
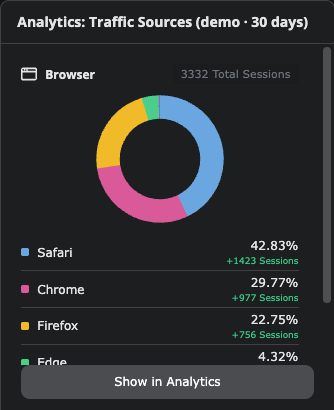
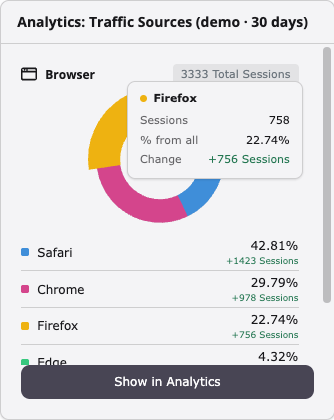
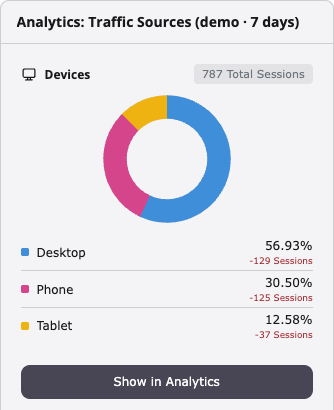
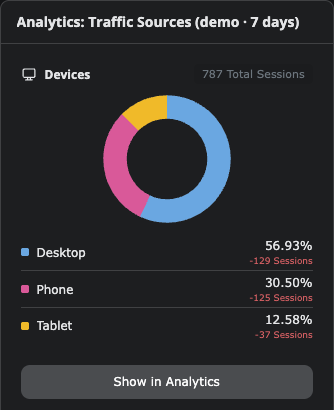
Widget settings (v14+):
| Setting | Type | Default | Description |
|---|---|---|---|
| Site | string | first registered site | Site to display data for. |
| Period | int | dashboardDefaultPeriod | Time window in days. |
| Chart type | enum | (per widget) | Display as list (progress bars) or donut
(SVG donut chart, top 5 + aggregated "Other"). |
On TYPO3 v13, all four sections are shown inside a single widget, stacked vertically. Site and period are selected via inline dropdowns.
Dashboard presets
The extension ships a ready-made dashboard preset called Analytics Overview. It can be selected when creating a new dashboard via the Add dashboard wizard and pre-populates the dashboard with all available analytics widgets:
- Traffic Graph
- Site Performance
- Top Pages
- Traffic Sources (v13: combined widget; v14+: Channel, Devices, Browser, Countries)
The preset is a convenience starting point — widgets can be removed, reordered, or supplemented with other TYPO3 dashboard widgets after creation.