Frequently Asked Questions
Warning
SAV Charts is now using Chart.js 4.x. Several breaking changes were made in
Chart.js 3.0 and Chart.js 4.0 (see 3.x Migration Guide
and 4.x Migration Guide).
All templates in Resources/
were modified to take these changes into consideration.
If you are upgrading Sav Charts, you may have to modify your templates.
How to Generate a Boolean Value?
Set the attribute value to true or false.
<data id="barChartOptions">
    <item key="animation" value="false" />
    <item key="responsive" value="false" />
    <item key="plugins">
        <item key="title">
            <item key="display" value="true" />
            <item key="text" value="marker#title" />
        </item>
        <item key="tooltip">
            <item key="backgroundColor">rgba(0,0,0,0.7)</item>
        </item>
    </item>
</data> <c:data id="barChartOptions">
<c:item key="animation" value="false" />
<c:item key="responsive" value="false" />
<c:item key="plugins">
<c:item key="title">
<c:item key="display" value="true" />
<c:item key="text" value="{marker__title}" />
</c:item>
<c:item key="tooltip">
<c:item key="backgroundColor">rgba(0,0,0,0.7)</c:item>
</c:item>
</c:item>
</c:data>
How to Set the y-Axis Properties?
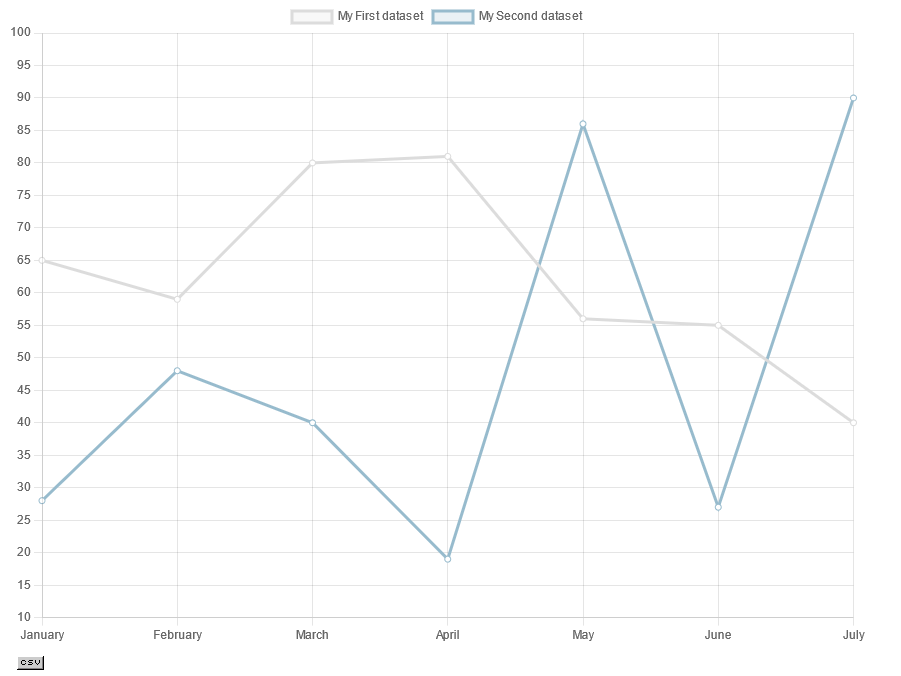
You can change the default y-axis (or x-axis) properties using the options for the chart. For example, assume that the y-axis for the lineChart example has to be changed so that the minimum is 10, the maximum is 100 and the step is 5.
Add the following configuration in the data section or in your template.
<data id="lineChartOptions">
    <item key="scales">
        <item key="y">
            <item key="max" value="100" />
            <item key="min" value="10" />
            <item key="ticks">
                <item key="stepSize" value="5" />
            </item>
        </item>
    </item>
</data> <c:data id="lineChartOptions">
<c:item key="scales">
<c:item key="y">
<c:item key="max" value="100" />
<c:item key="min" value="10" />
<c:item key="ticks">
<c:item key="stepSize" value="5" />
</c:item>
</c:item>
</c:item>
</c:data> Save, clear the cache and go to the front-end.
Tip
You can easily adapt the previous configuration to other cases by translating the JavaScript configuration examples given in the Charts.js documentation.
The translation is simple:
- Replace options by a
<data id="..."> ... </where thedata> idis the identifier for the chart options (it is defined in the template). - Replace opening braces by
<item>tags with attributes as keys. - Replace open brackets, if any, by
<item>tags with keys equal to 0. - Replace simple attributes inside braces by
<item />tags with key and value attributes. - Replace closing braces or brackets by
</tags.item>
- Replace options by a
<c:where thedata id="..."> ... </ c: data> idis the identifier for the chart options (it is defined in the template). - Replace opening braces by
<c:tags with attributes as keys.item> - Replace open brackets, if any, by
<c:tags with keys equal to 0.item> - Replace simple attributes inside braces by
<c:tags with key and value attributes.item /> - Replace closing braces or brackets by
</tags.c: item>
For example, the following code changes also the label style of the x-axis. A callback is used to modify the tick labels.
<data id="lineChartOptions">
    <item key="scales">
        <item key="y">
            <item key="max" value="100" />
            <item key="min" value="10" />
            <item key="ticks">
                <item key="stepSize" value="5" />
            </item>
        </item>
        <item key="x">
            <item key="ticks">
                <item key="font">
                    <item key="size" value="15" />
                    <item key="tyle" value="italic" />
                </item>
                <item key="color" value="rgb(200, 0, 0)" />
                <callback key="callback">
                    <!--
                    function(value, index, values) {
                        return '- ' + this.getLabelForValue(value) + ' -';
                    }
                    -->
                </callback>
            </item>
        </item>
    </item>
</data>Note
The JavaScript function must be in an XML comment.
<c:data id="lineChartOptions">
    <c:item key="scales">
        <c:item key="y">
            <c:item key="max" value="100" />
            <c:item key="min" value="10" />
            <c:item key="ticks">
                <c:item key="stepSize" value="5" />
            </c:item>
        </c:item>
        <c:item key="x">
            <c:item key="ticks">
                <c:item key="font">
                    <c:item key="size" value="15" />
                    <c:item key="tyle" value="italic" />
                </c:item>
                <c:item key="color" value="rgb(200, 0, 0)" />
                <c:callback key="callback">
                    function(value, index, values) {
                        return '- ' + this.getLabelForValue(value) + ' -';
                    }
                </c:callback>
            </c:item>
        </c:item>
    </c:item>
</c:data>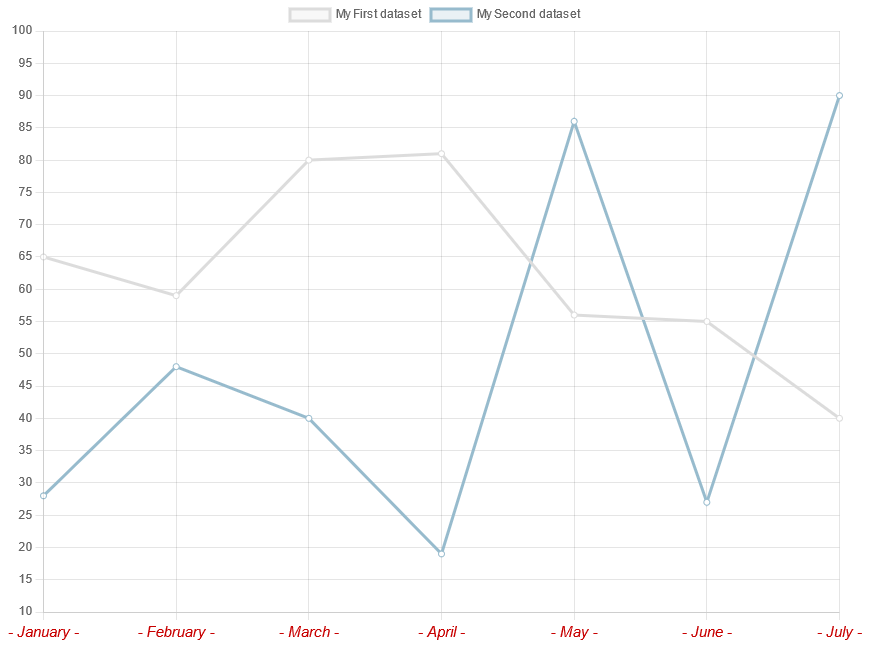
Note
In Chart.js 3.0 , the former x and y arrays in scales were removed.
How to Modify the Tooltip Format?
The tooltip format can be modified using callbacks that are provided with Chart.js.
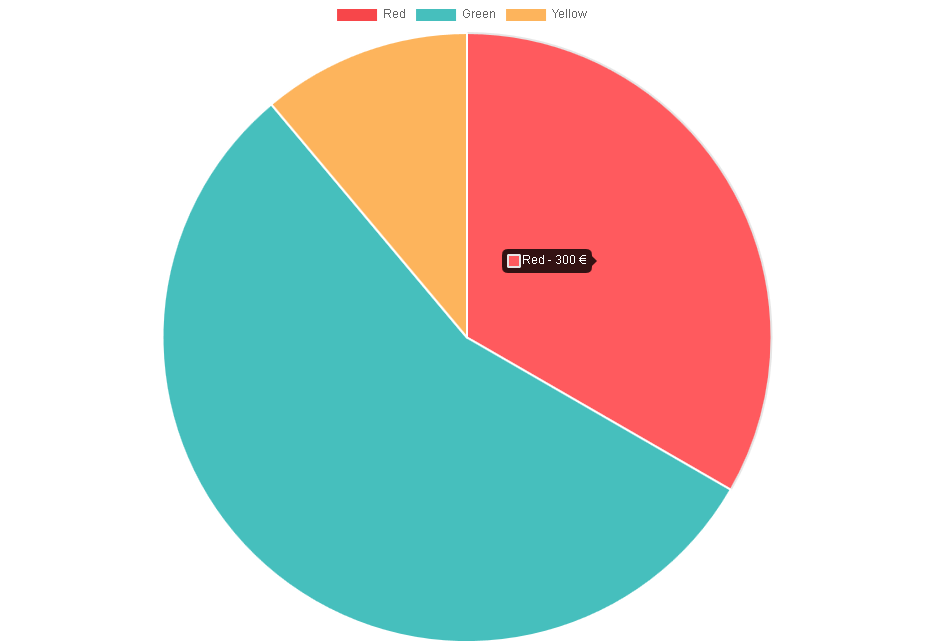
For example let us assume that data provided with the Pie Chart example
are in €. Let us also assume that we want to change the tiptool content
in order to have label - value € instead of the defaut format label:.
Chart.js library allows to modify several behaviors by means of callbacks. Please consult the Chart.js documentation for details.
The tooltip label can been changed by means of the label callback in tooltip options.
Inline JavaScript Function
Add the following configuration in the data section or in your template.
<data id="pieChartOptions">
    <item key="plugins">
        <item key="tooltip">
            <item key="callbacks">
                <callback key="label">
                    <!--
                    function(context) {
                        return context.label + ' - ' + context.formattedValue + ' €';
                    }
                    -->
                </callback>
            </item>
        </item>
    </item>
</data>Note
The JavaScript function must be in an XML comment.
<c:data id="pieChartOptions">
    <c:item key="plugins">
        <c:item key="tooltip">
            <c:item key="callbacks">
                <c:callback key="label">
                    function(context) {
                        return context.label + ' - ' + context.formattedValue + ' €';
                    }
                </c:callback>
            </c:item>
        </c:item>
    </c:item>
</c:data>Save, clear the cache and go to the front-end.
The configuration is simply the translation of the following JavaScript configuration.
options: {
    plugins: {
        tooltip: {
            callbacks: {
                label: function(context) {
                    return context.label + ' - ' + context.formattedValue + ' €';
                }
            }
        }
    }
}Note
In Chart.js 3.0 tooltips was renamed tooltip and
is now in the plugins item of the options. A tooltip item context is avaible in callbacks.
For more information see the tooltip section
in Chart.js documentation.
JavaScript Function in a File
When the JavaScript function associated with the callback is more complex, you can also put it in a file and call that file in the callback as shown in the following configuration.
<data id="pieChartOptions">
    <item key="plugins">
        <item key="tooltip">
            <item key="callbacks">
                <callback key="label">
                    EXT:sav_charts/Resources/Public/Callbacks/TooltipLabel.js
                </callback>
            </item>
        </item>
    </item>
</data><c:data id="pieChartOptions">
<c:item key="plugins">
<c:item key="tooltip">
<c:item key="callbacks">
<c:callback key="label">
EXT:sav_charts/Resources/Public/Callbacks/TooltipLabel.js
</c:callback>
</c:item>
</c:item>
</c:item>
</c:data> How to call a JavaScript Function on Events?
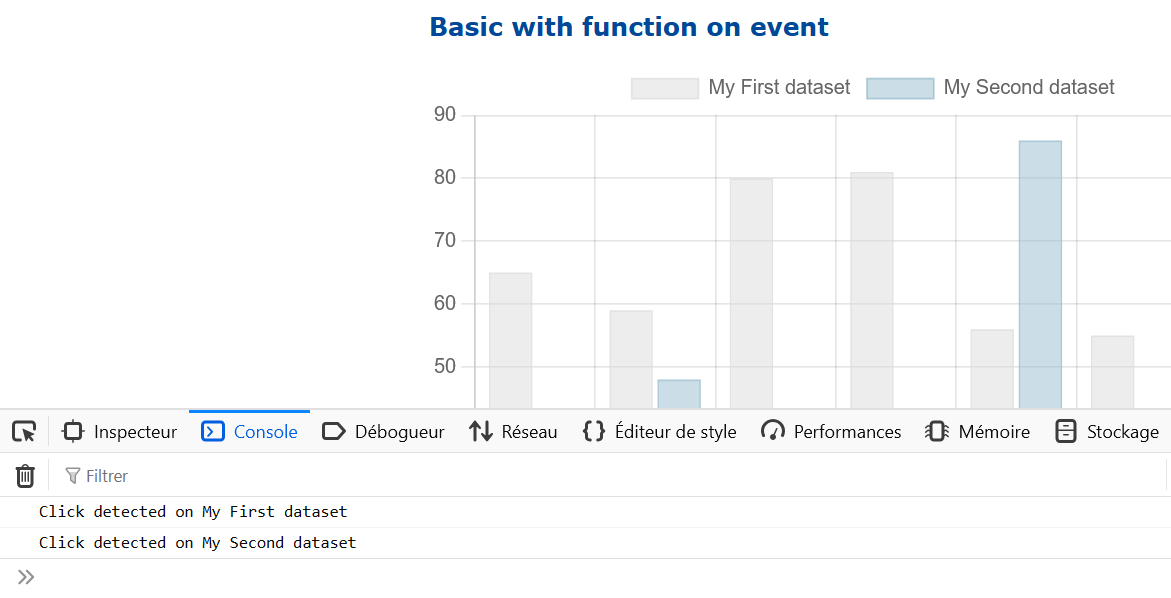
The following configuration shows how to associate the JavaScript function
new with the on event of the legend.
<data id="barChartOptions">
    <item key="plugins">
        <item key="legend">
            <item key="onClick" type="function" value="newLegendClickHandler" />
        </item>
    </item>
</data>

<template id="1">
    EXT:sav_charts/Resources/Private/Templates/ChartsExamples/BarChart.xml
</template> <c:data id="barChartOptions">
<c:item key="plugins">
<c:item key="legend">
<c:callback key="onClick">newLegendClickHandler</c:callback>
</c:item>
</c:item>
</c:data>
<c:template id="1">
EXT:sav_charts/Resources/Private/Templates/ChartsExamples/FluidParser/BarChart.fluid
</c:template> The function new
is available in Resources and must be
inserted by TypoScript.
page.includeJSFooter{
    newLegendClickHandler = EXT:sav_charts/Resources/Public/Callbacks/NewLegendClickHandler.js
} Open the console and click on the chart legend.
How to Create a Combination Chart?
An example which combines a bar chart and a line chart is provided in the directory
Resources/. Create a new graph then, in the template
section, enter the following code, save and go to the front-end.
<template id="1">
    EXT:sav_charts/Resources/Private/Templates/ChartsExamples/ComboChart.xml
</template> <c:template id="1">
EXT:sav_charts/Resources/Private/Templates/ChartsExamples/ComboChart.xml
</c:template> 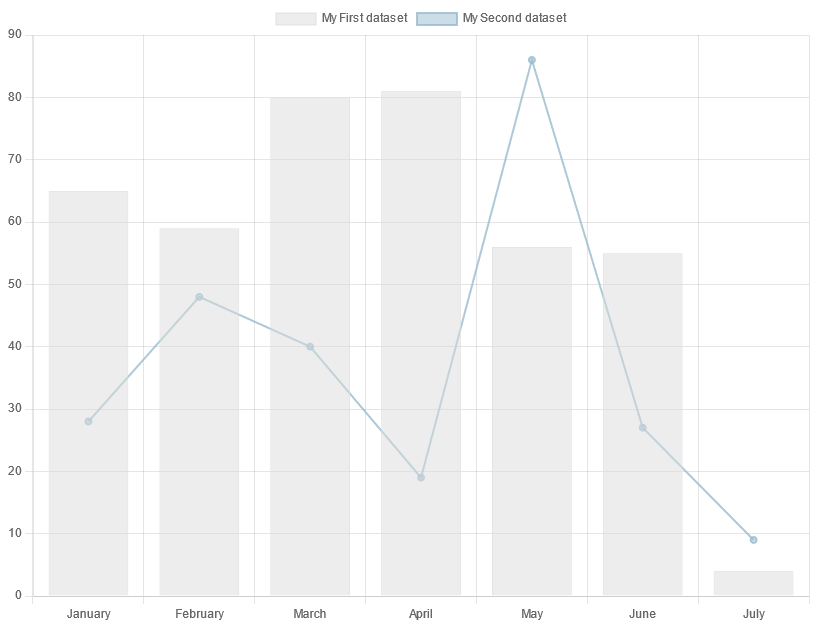
The file Combo is very similar to the file Bar. Only slight changes were made.
The type attribute of the second dataset is set to line and the fill attribute to false.
<data id="set1">
    <item key="type">line</item>
    <item key="fill" value="false"/>
        ...
</data><c:data id="set1">
<c:item key="type">line</c:item>
<c:item key="fill" value="false"/>
...
</c:data>The value for the type attribute of each chart is given in
the Chart.js documentation.
How to use Plugins?
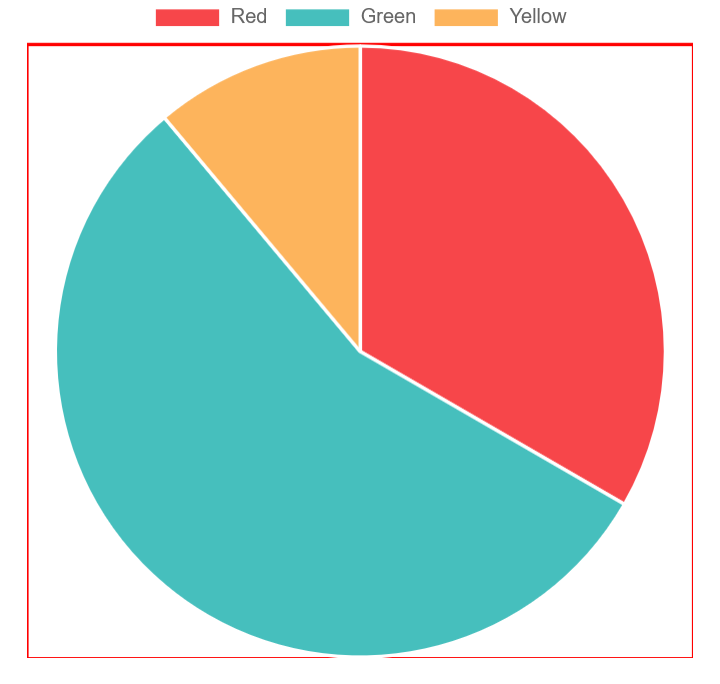
A plugin to draw a border around the chart is
available in Resources.
<plugin chartId="pieChart#1" key="chartAreaBorder" fileName="EXT:sav_charts/Resources/Public/Plugins/ChartAreaBorder.js" />

<data id="pieChartOptions">
  <item key="plugins">
    <item key="chartAreaBorder">
      <item key="borderColor">red</item>
      <item key="borderWidth">2</item>
    </item>
  </item>
</data>

<template id="1">
    EXT:sav_charts/Resources/Private/Templates/ChartsExamples/PieChart.xml
</template><c:plugin chartId="pieChart__1" key="chartAreaBorder" fileName="EXT:sav_charts/Resources/Public/Plugins/ChartAreaBorder.js" />
<c:data id="pieChartOptions">
<c:item key="plugins">
<c:item key="chartAreaBorder">
<c:item key="borderColor">red</c:item>
<c:item key="borderWidth">2</c:item>
</c:item>
</c:item>
</c:data>
<c:template id="1">
EXT:sav_charts/Resources/Private/Templates/ChartsExamples/FluidParser/PieChart.fluid
</c:template>