Introduction
What Does it Do?
This extension displays charts using the Chart.js library.
SAV Charts was originally designed to build chart configurations through XML tags instead of JavaScript. Markers can be introduced in templates. Data can also be changed through XML either manually or using query managers.
Important
Starting with version 14.5.0 of SAV Charts, a new parser based solely on Fluid and specific viewHelpers has been introduced. Thanks to Fluid syntax, it simplifies writing complex charts and using references.
While generating charts is faster with the XML parser, writing complex code is much simpler with the Fluid parser.
The following charts type are available :
- Bar charts
- Bubble charts
- Doughnut charts
- Line charts
- Pie charts
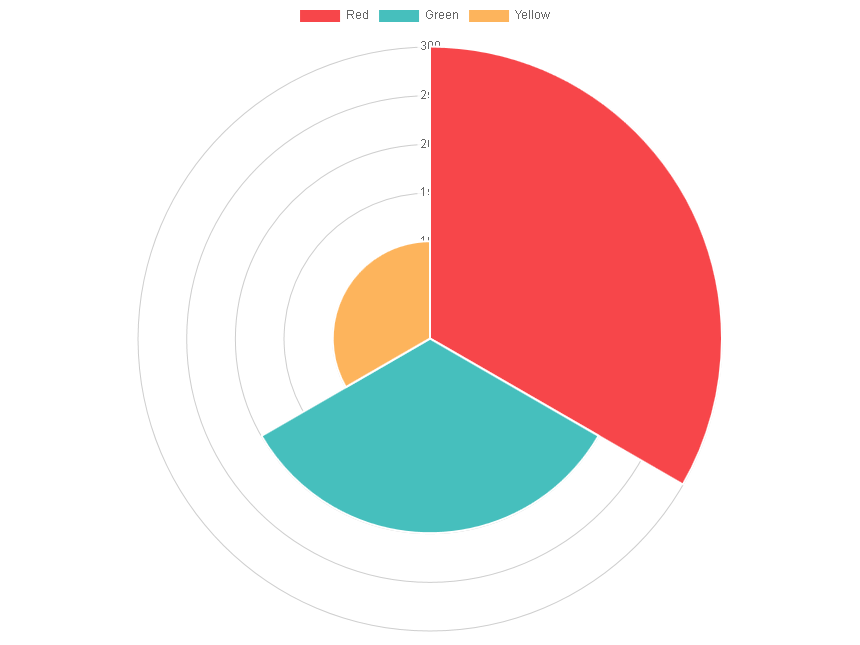
- Polar area charts
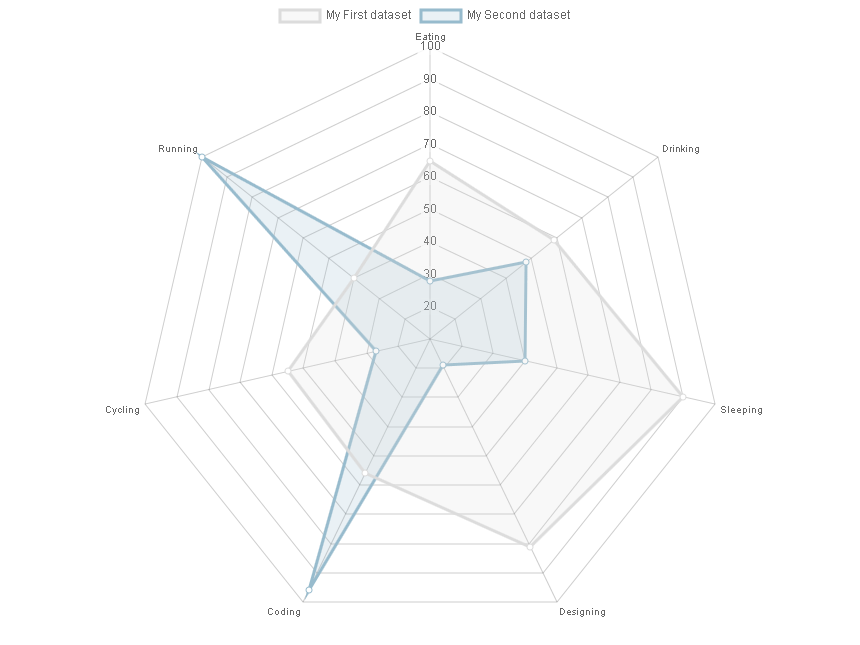
- Radar charts
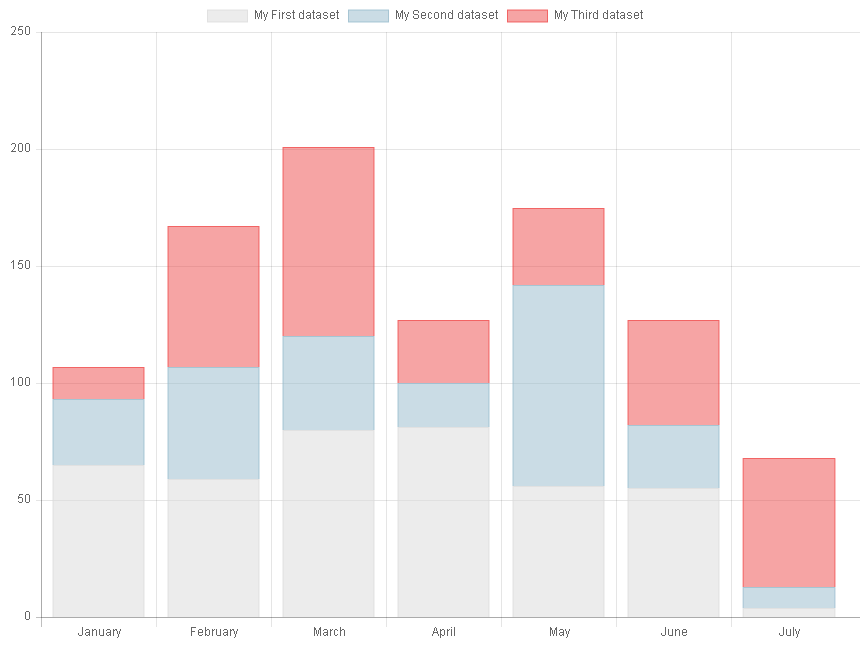
- Stacked bar charts
- Horizontal bar charts
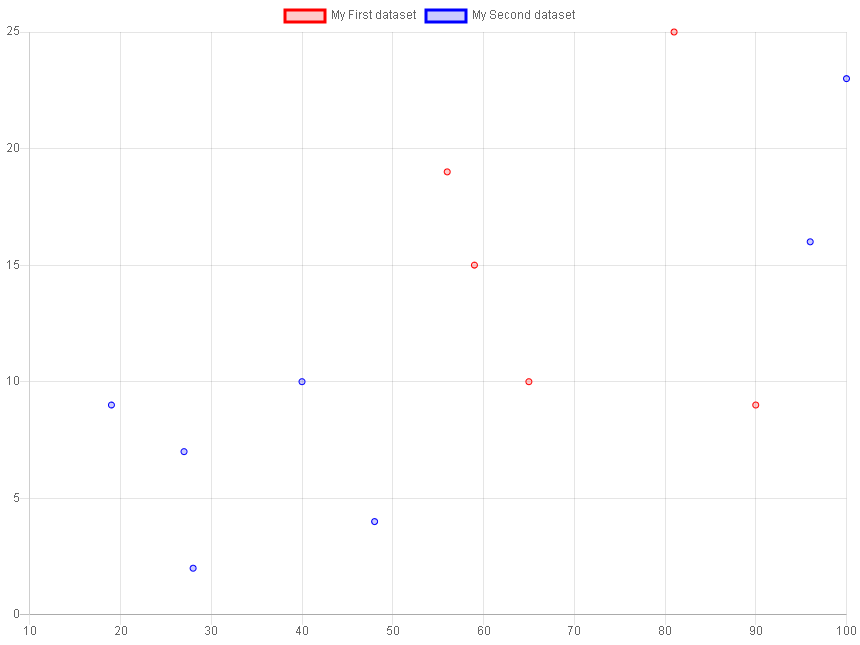
- Scatter Line Charts
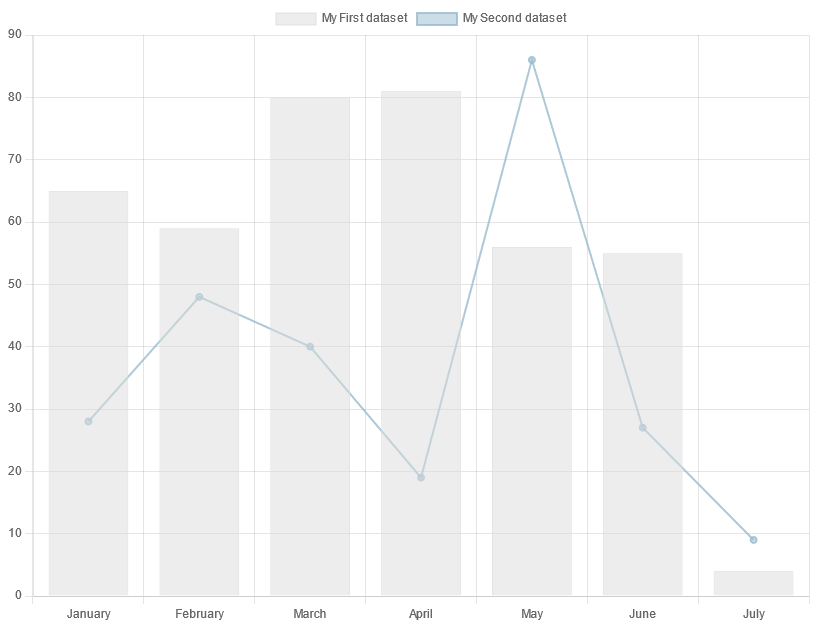
- Charts can also be combined (Combo charts), e.g. a bar chart with a line chart
Tip
SAV Charts is provided with several basic templates and more advanced
templates which simplify the implementation of charts with several sets of data.
XML Templates are in the directory Resources/.
XML templates were also converted to Fluid templates and are available in
Resources/.
The following screenshots are obtained with the provided basic templates.
Screenshots
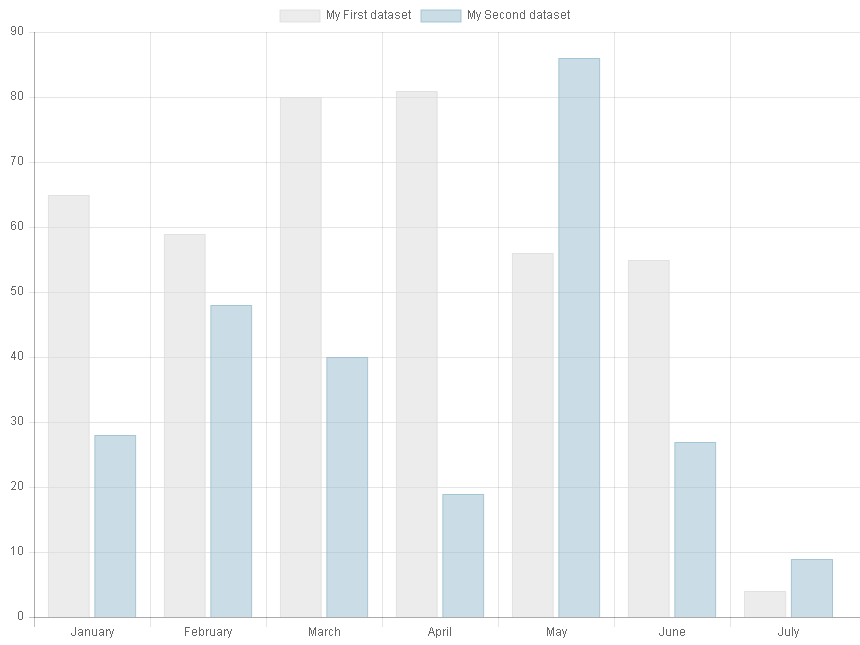
Bar Chart
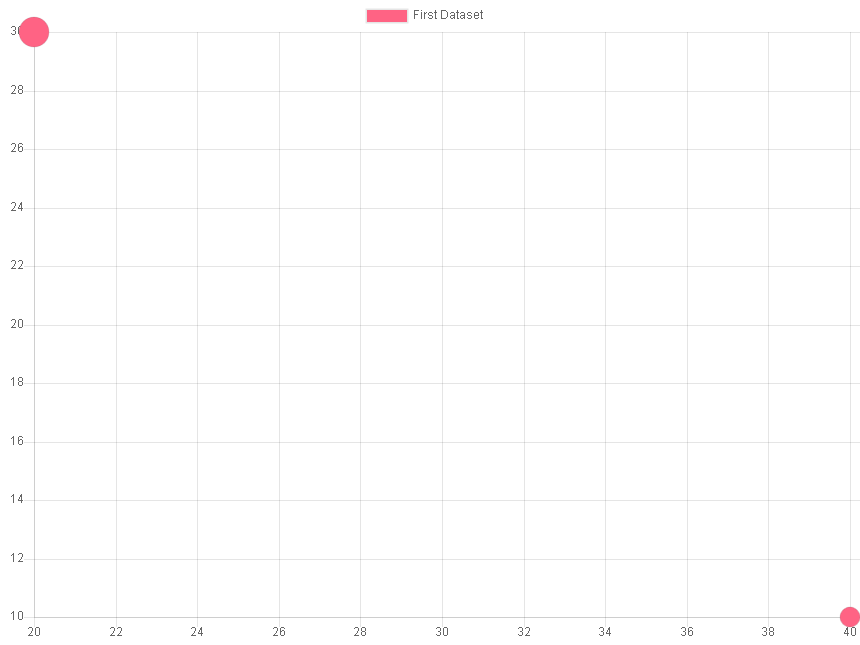
Bubble Chart
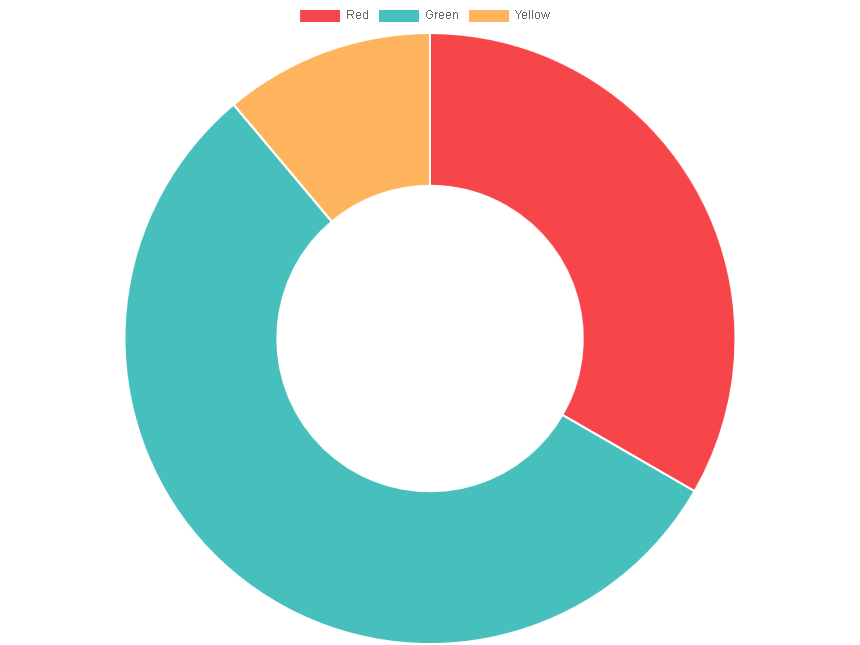
Doughnut Chart
Horizontal Bar Chart
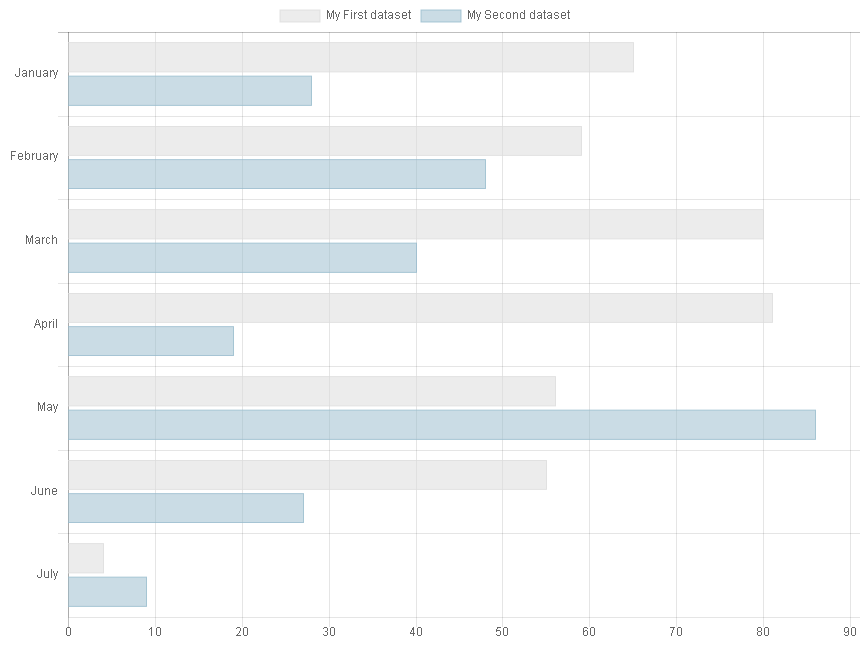
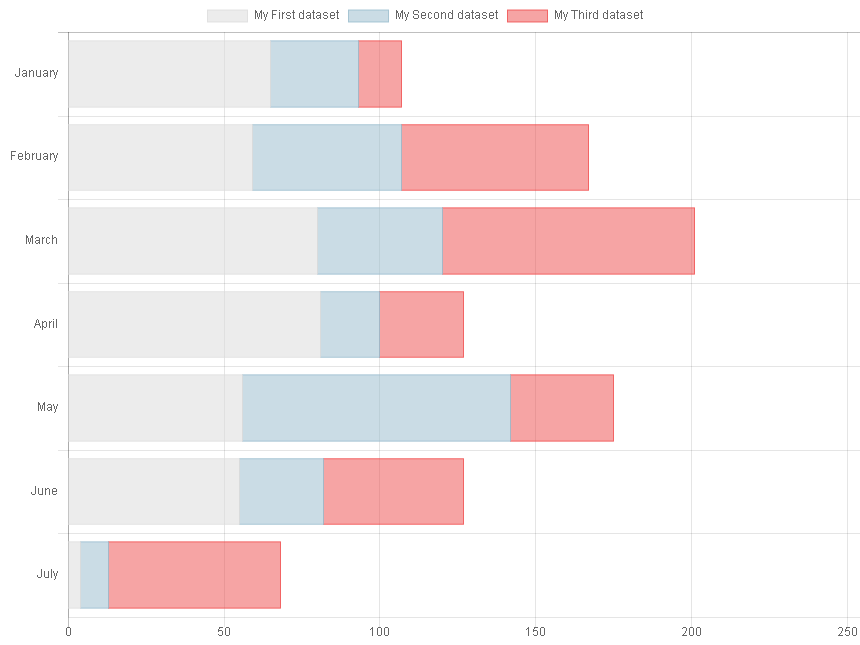
Horizontal Stacked Bar Chart
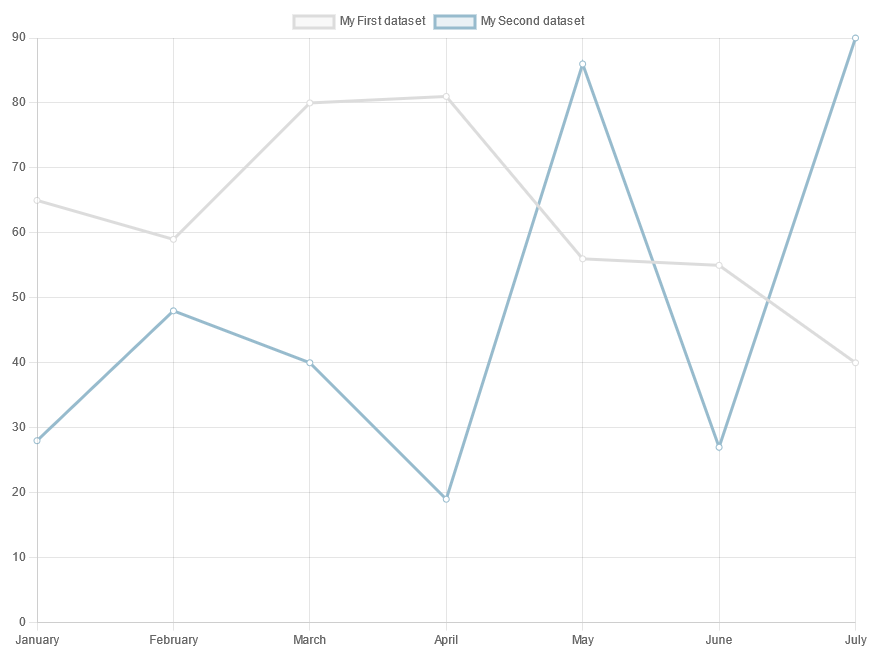
Line Chart
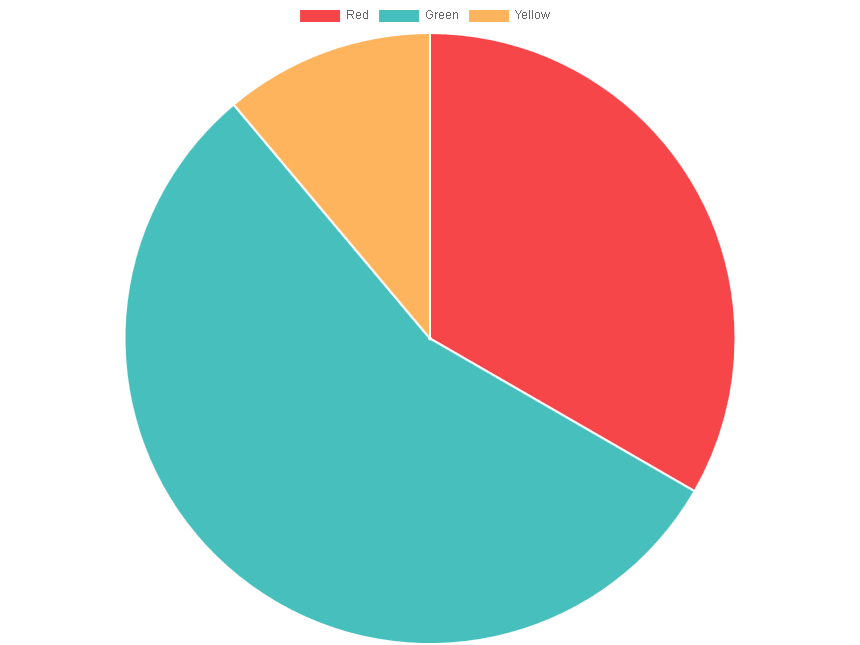
Pie Chart
Polar Area Chart
Radar Chart
Scatter Chart
Stacked Bar Chart
Combination Chart