Using Advanced Templates
SAV Charts provides more complex templates. They can display up to nine items on the same chart.
The colors are defined in a specific template,
either Default for the XML parser
or Fluid for the
Fluid parser. These colors were chosen to
provide contrast between items.
To illustrate the use of advanced templates,
consider the Line template or
the Fluid
template.
Enter the following code in the template section, then save and go to the front end.
<template id="1">
    EXT:sav_charts/Resources/Private/Templates/ChartsExamples/LineChartAdvanced.xml
</template> <c:template id="1">
EXT:sav_charts/Resources/Private/Templates/ChartsExamples/FluidParser/LineChartAdvanced.fluid
</c:template> 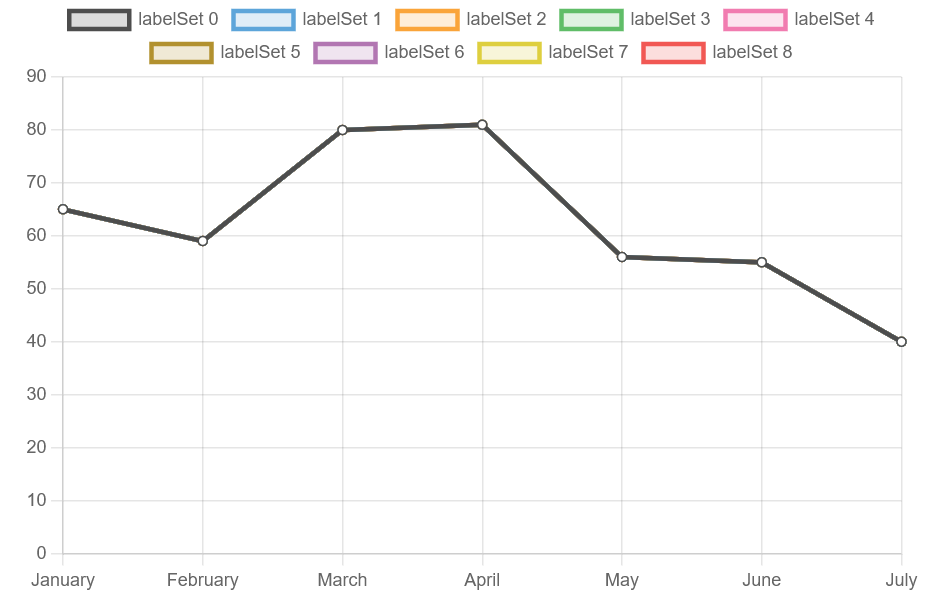
The chart has nine superimposed curves with the same data, as well as predefined colors, labels, and a title. Click on the legend to hide a curve.
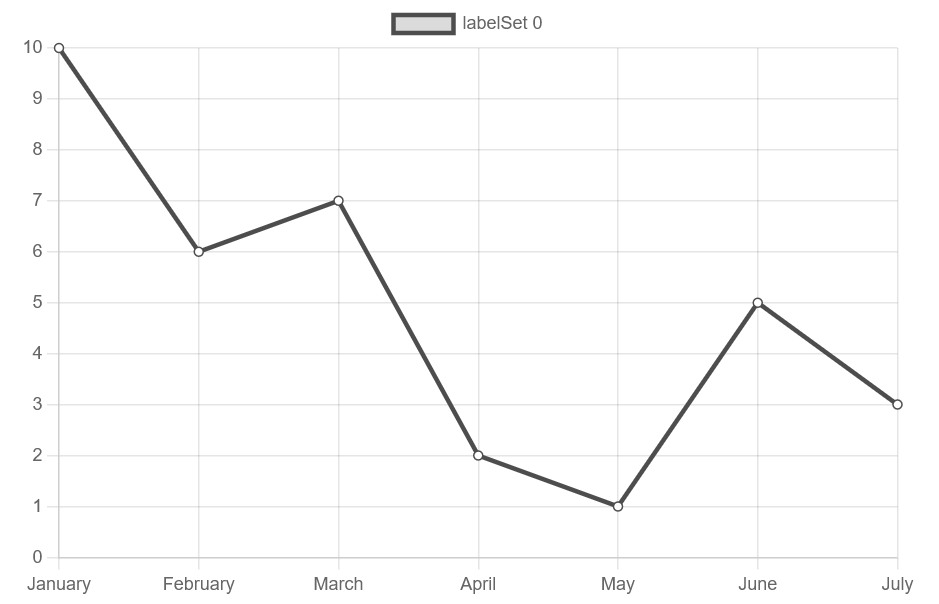
In the data section enter the following code, save, and go to the front-end.
<data id="data">
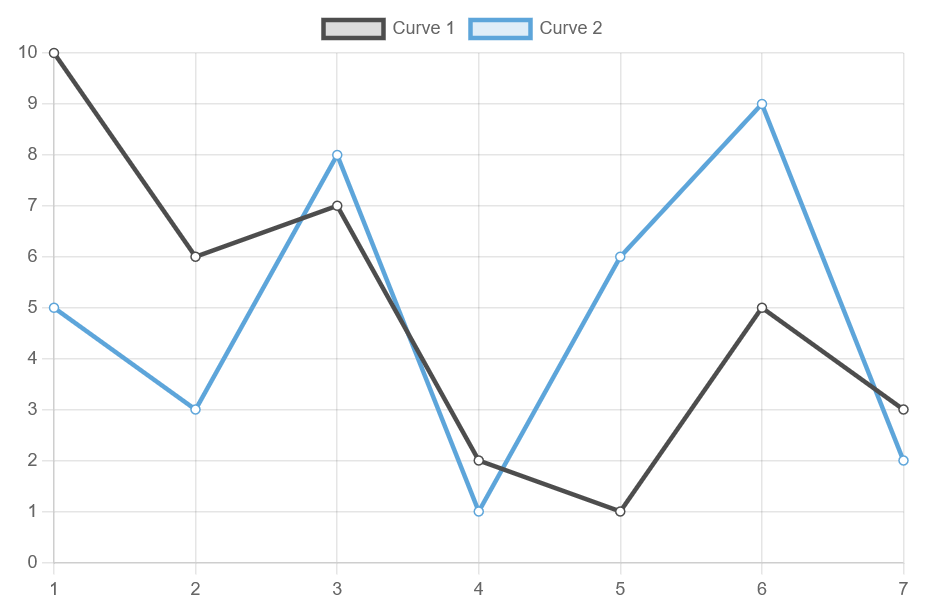
    <item key="0" values="10, 6, 7, 2, 1, 5, 3" />
</data> <c:data id="data">
<c:item key="0" values="10, 6, 7, 2, 1, 5, 3" />
</c:data>
Modify the data section as follows:
<data id="data">
    <item key="0" values="10, 6, 7, 2, 1, 5, 3" />
    <item key="1" values="5, 3, 8, 1, 6, 9, 2" />
</data>

<data id="labels">
    1, 2, 3, 4, 5, 6, 7
</data><c:data id="data">
<c:item key="0" values="10, 6, 7, 2, 1, 5, 3" />
<c:item key="1" values="5, 3, 8, 1, 6, 9, 2" />
</c:data>
<c:data id="labels">
1, 2, 3, 4, 5, 6, 7
</c:data>
Enter the following code in the marker section, then save and go to the front-end.
<marker id="title">A line chart with two curves</marker>
<marker id="labelSet0">Curve 1</marker>
<marker id="labelSet1">Curve 2</marker> <c:marker id="title">A line chart with two curves</c:marker>
<c:marker id="labelSet0">Curve 1</c:marker>
<c:marker id="labelSet1">Curve 2</c:marker>